
Selecting a Battery-Electric LHD for Underground Mining: Payload and Shift Runtime





Selecting a Battery-Electric LHD for Underground Mining: Payload and Shift Runtime
For engineers assessing battery electric LHD loader mining performance, rated payload and advertised battery runtime are only starting points. The real selection challenge is matching tonnes moved per shift to haul distance, gradients, material density, usable battery capacity, and charging or swapping downtime. A larger bucket does not guarantee higher productivity if energy limits interrupt the duty cycle.
The useful comparison is not “Which machine runs longest?” It is “Which machine delivers the required tonnes, on this route, with a workable energy-replenishment plan?” That distinction matters when a loader must serve several headings, share an orepass, or travel away from production to reach its charger.
Define the shift before comparing the loader
An eight-hour roster does not mean eight hours of loading and hauling. Blast clearance, inspections, operator changes, road maintenance, and downstream congestion reduce the production window. Some interruptions can accommodate charging; others leave the loader stranded far from the charging bay. Treating all non-producing time as available charging time gives an optimistic result.
Build the assessment around representative routes rather than a single average distance. Include a normal production route, a demanding route with adverse gradients or poor floor conditions, and the longer route expected as development advances. Record loaded and empty travel separately. A loaded uphill haul has a different energy profile from a loaded downhill haul, even when the distance is identical.
For each route, establish actual loading, travel, dumping, and queue times. Dispatch records are useful, but check them against field observations: a delay coded as “loading” may actually be waiting for a truck. Otherwise, the energy model and productivity model start from different versions of the same shift.
Payload is constrained by material and geometry
Rated payload is a mass limit, not a promise that every bucket will carry that mass. Actual bucket load depends on loose bulk density, fragmentation, fill factor, bucket geometry, and muckpile access. Use loose material density rather than intact rock density; blasting changes the volume occupied by a given mass.
Estimated bucket payload = bucket volume × loose bulk density × fill factor
That estimate remains subject to the manufacturer’s payload limit and operating restrictions. Dense ore may reach the mass limit before the bucket appears full. Lighter material may fill the bucket without reaching rated payload. A larger bucket can help in the second situation, but it is not a safe remedy for the first.
Check bucket width, articulation clearance, turning envelope, dump height, and breakout capability against the working area. A higher-capacity LHD that needs repeated repositioning at a tight drawpoint can lose its nominal advantage. Additional bucket-filling attempts also consume hydraulic energy without adding proportionate tonnes.
The practical question is whether the next payload class increases delivered tonnes per cycle enough to offset its cycle time and energy demand. Do not assume either that a larger machine is more efficient or that a smaller machine necessarily uses less energy per tonne.
Convert battery capacity into a route-specific energy budget
Nameplate capacity is not dispatchable energy. The battery-management system controls an operating state-of-charge window, and the mine may need a further reserve for diversion, congestion, or travel to a safe replenishment location. Confirm whether the supplier’s quoted capacity is gross or usable before applying any deductions; otherwise, the same restriction may be counted twice.
Request usable energy and available power at the agreed end-of-life battery condition, not only with a new pack. Capacity fade reduces operating time, while changes in resistance can affect power delivery and heat generation. A pack may contain sufficient energy yet be unable to sustain the required performance under particular temperature or state-of-charge conditions.
The energy model should cover traction, bucket filling, lifting and dumping, cooling, and auxiliary loads. Waiting is not necessarily energy-free: cooling pumps, controls, lighting, and cab systems may remain active. For short loading cycles, hydraulic demand deserves particular attention; for longer ramp routes, traction may dominate.
Cycles between replenishment ≈ dispatchable battery energy ÷ measured energy per representative cycle
Use this as a planning relationship, not a guarantee. Cycle energy changes with road resistance, payload, operator technique, temperature, and traffic. Measure energy at a consistent boundary—preferably net battery discharge for vehicle-runtime calculations—and use wall-side electricity separately when assessing charging losses and operating cost.
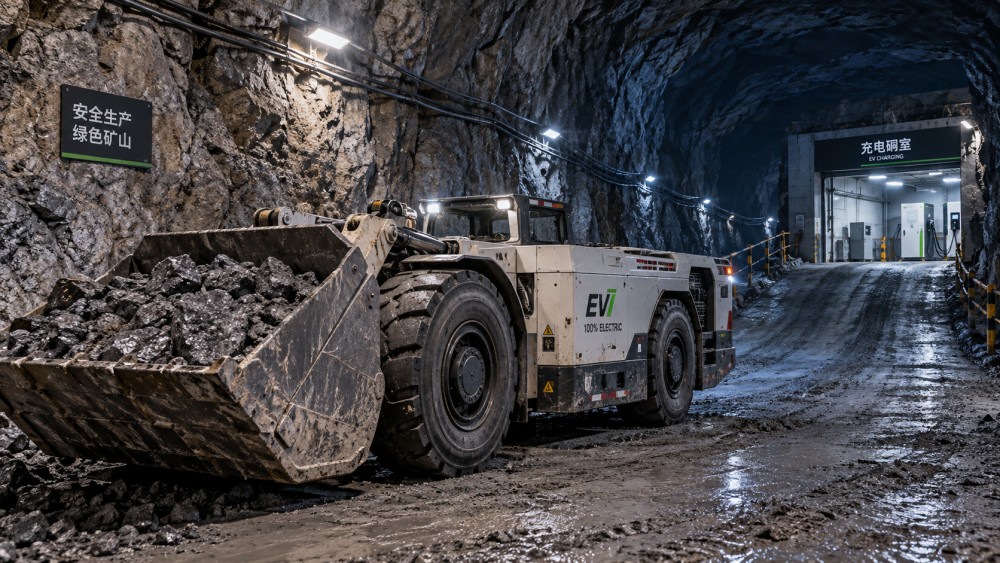
A route diagram showing loaded travel, empty return, gradients, waiting points, and the charging detour is often more revealing than a runtime chart. It exposes where energy is consumed and whether replenishment can realistically fit the production sequence.
Do not over-credit regenerative braking
Regeneration can recover some downhill energy, but the amount depends on loaded direction, speed, traction, conversion losses, and battery acceptance limits. A nearly full or thermally constrained pack may accept less regenerative power. Ask suppliers to model the actual elevation profile and initial state of charge rather than applying a general recovery percentage.
Also verify braking performance when regeneration is restricted. The friction-braking system and operating procedures must remain suitable for the duty; regenerative energy recovery is not a substitute for a complete downhill braking assessment.
Compare replenishment systems on lost production time
Charging and battery swapping solve different scheduling problems. Charging may suit a machine with predictable pauses and convenient access to power. Swapping may support longer production windows, but only if charged packs, handling equipment, space, and trained personnel are available when required.
For either arrangement, include travel, queuing, isolation, connection or exchange, checks, and return to production. Then subtract only the downtime genuinely absorbed by an existing break. Check the fleet schedule too: several loaders seeking energy at shift change can turn an adequate individual charging plan into a bottleneck.
Infrastructure belongs in the selection decision. Confirm electrical supply capacity, cooling requirements, access for maintenance, battery quarantine arrangements, and emergency response against site conditions and applicable requirements. Battery-electric operation eliminates diesel exhaust at the machine, but it does not eliminate heat, dust, or the need for mine ventilation.
Put payload and runtime into the same production calculation
Consider a simplified comparison—not a manufacturer performance claim. Loader A averages 12 tonnes per completed cycle and delivers 40 cycles in the available production window: 480 tonnes. Loader B averages 14 tonnes but completes only 33 cycles after its longer replenishment interruption: 462 tonnes. The larger payload loses on shift output.
The result could reverse if Loader B’s replenishment overlaps a planned shutdown or its charging bay moves closer to the workplace. That is the point: payload and battery runtime cannot be ranked independently of the operating plan.
Calculate completed cycles from a shift timeline that includes both production and energy interruptions. Avoid double-counting delays already included in measured cycle times. Compare tonnes per shift alongside battery energy per tonne, wall-side electricity per tonne, and the supporting assets required. A loader that meets the target only with a dedicated spare machine or additional battery inventory carries a different system cost.
Run sensitivity checks for longer haul distances, lower bucket fill, degraded batteries, and an unavailable charger or swap station. The preferred machine should not depend on every assumption being favourable.
Make the acceptance test resemble the mine
Ask shortlisted suppliers to evaluate the same route, payload distribution, shift calendar, and battery condition. A demonstration on a level test circuit cannot establish performance on a rough ramp with loaded uphill travel. Where a representative site trial is unavailable, document the model’s assumptions and uncertainty explicitly.
The trial record should link payload, completed cycles, state of charge, battery temperature, energy consumption, replenishment time, and reasons for delay. Record power derating and interrupted cycles, not just the best uninterrupted run. If remote or autonomous operation is planned, test the relevant communications coverage, recovery procedures, and operating mode rather than assuming manual-cycle results transfer unchanged.
For UTMD’s coverage of underground transport electrification, this system-level comparison is more useful than an isolated battery specification. Machine performance, energy infrastructure, and dispatch logic meet at the same production target.
Before selection, agree on the required shift tonnage, representative route, minimum operating reserve, battery condition, and replenishment availability. Then establish how those conditions will be verified. A credible purchase decision rests on repeatable tonnes delivered under agreed constraints—not the largest bucket or the longest advertised runtime.
Related News
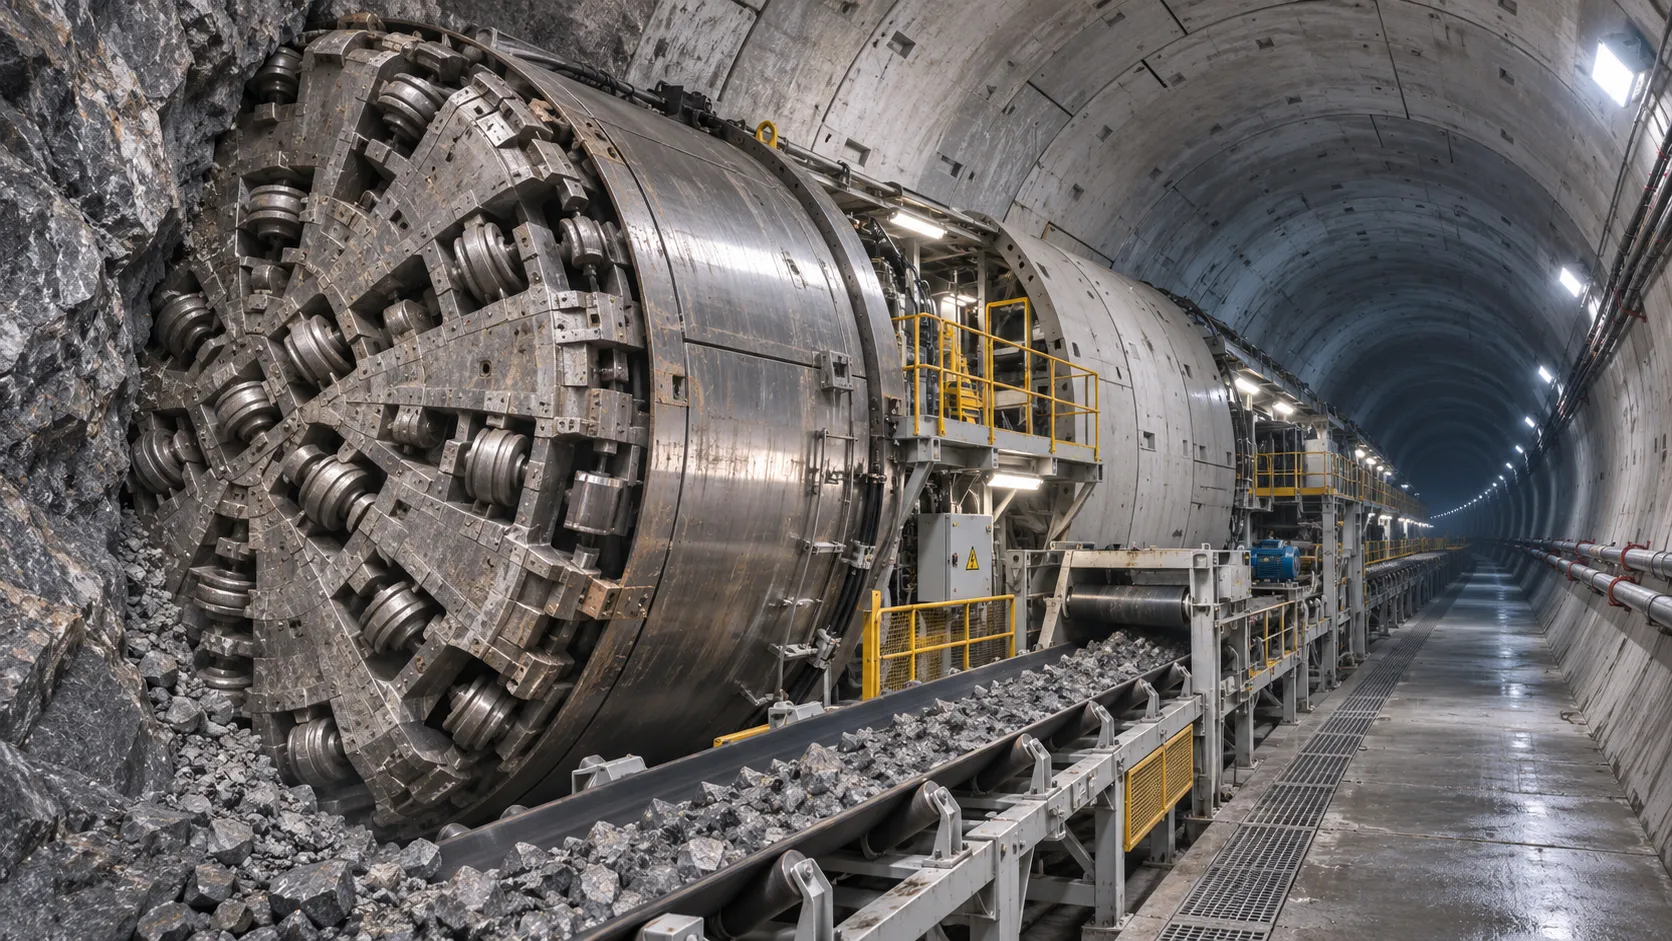
How TBM Excavation Works in Rock and Soft Ground: A Practical Guide
TBM Excavation in rock and soft ground explained: compare machine types, ground support, spoil removal, and the factors that guide smarter project planning.
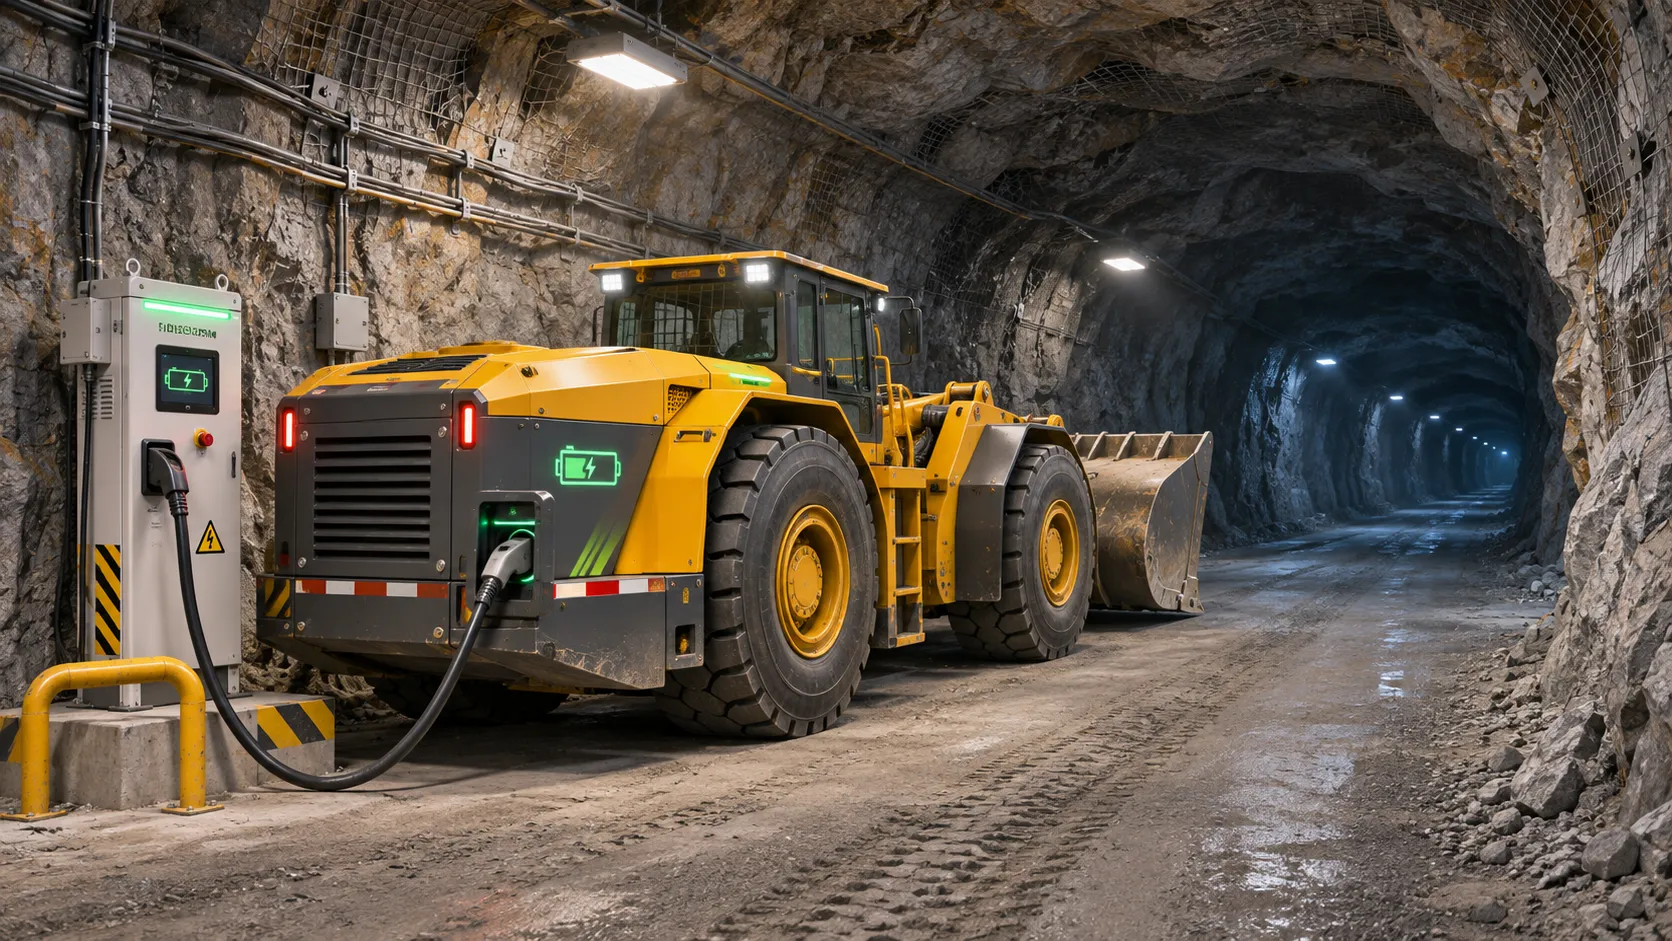
Choosing a Zero-Emission Underground Equipment Supplier: What to Check
Choosing a zero emission underground equipment supplier? Compare duty-cycle performance, charging, safety, total costs and support before you commit.
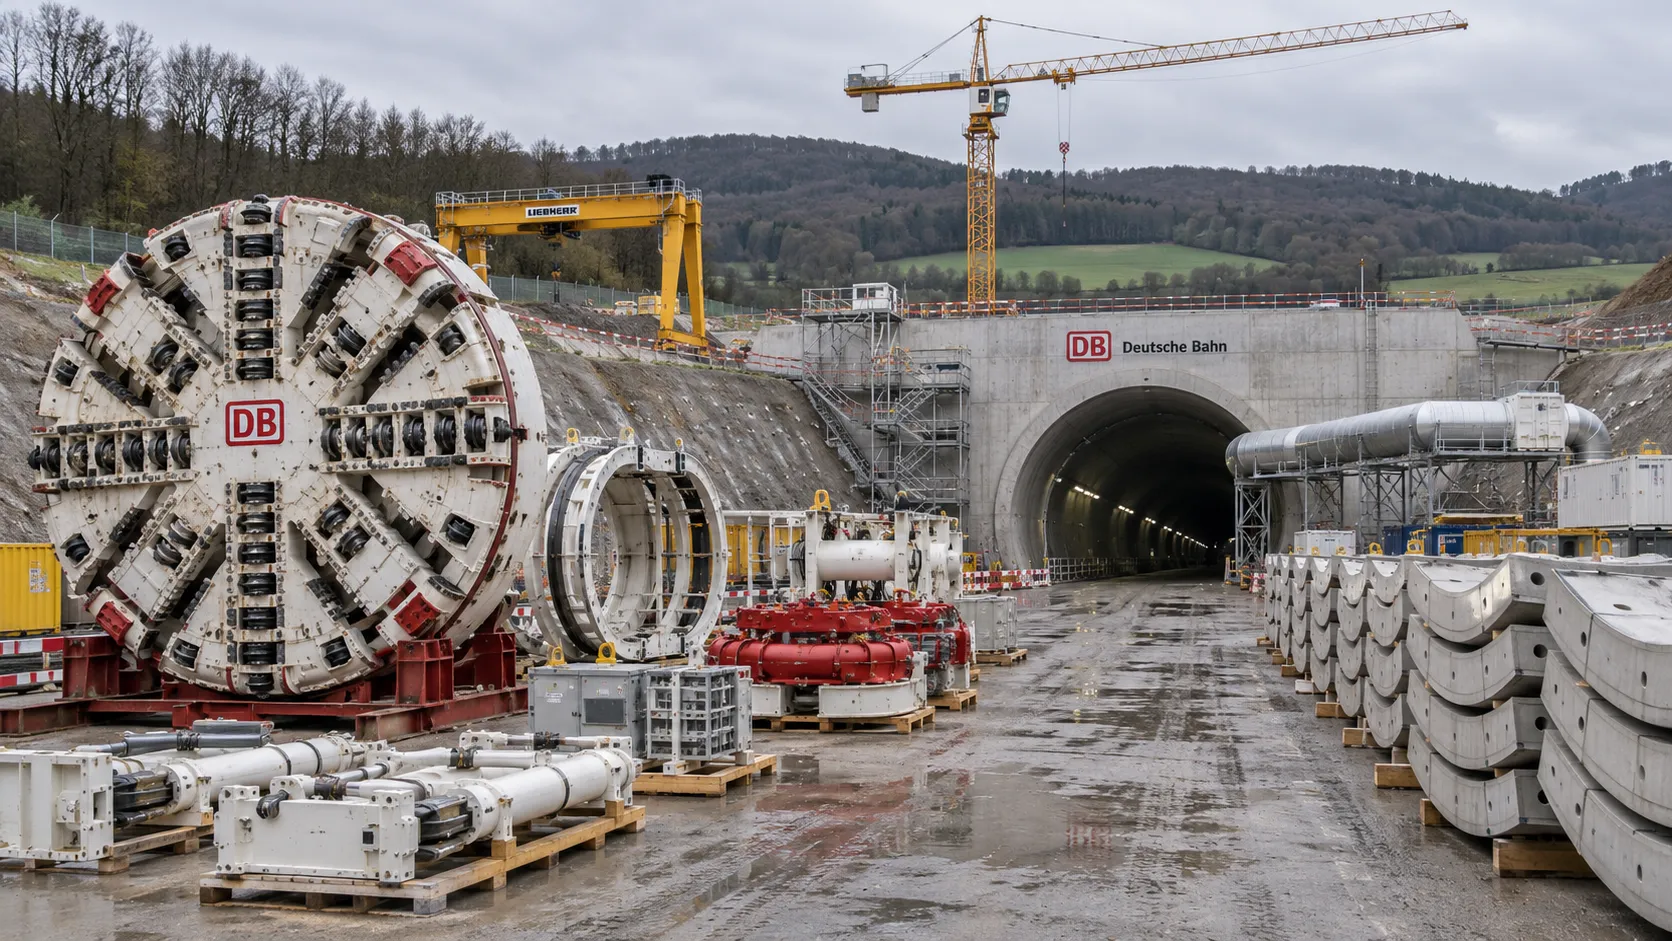
Construction Starts on Germany's Pfaffensteig Rail Tunnel, With Two TBMs Planned
Pfaffensteig rail tunnel construction is underway in Germany. Discover how two planned TBMs will support the 11-kilometre project near Stuttgart.
How Real-Time Underground Mapping Systems Work in Tunneling
Discover how real-time underground mapping systems guide tunneling teams, integrate sensor data, and support confident decisions with verified accuracy.
First Mechanized Tunnel Crossing Beneath the Panama Canal Completed
Panama Canal tunnel crossing: Explore the reported Metro Line 3 milestone and what it could mean for future underwater tunneling projects.
Underground Utility Construction Equipment: Choosing by Ground Conditions
Choose underground utility construction equipment with confidence. Compare trenching, HDD, microtunnelling and TBMs by ground conditions, risk and cost.
China Sets Tunnel Boring Machine Export Controls as India Pushes Local Production
China tunnel boring machine export controls could reshape procurement as India pushes local production. Explore potential supply and project impacts.
Choosing a Trenchless Pipeline Installation Contractor: Key Qualifications
Choose a trenchless pipeline installation contractor with confidence. Learn how to assess experience, equipment, safety, costs, and project risks before you hire.
China's 70% TBM Share and Export Controls Challenge India's Local Production
China's TBM export controls could challenge India's local production and infrastructure sourcing. Explore the potential risks and procurement options.
Related News
- 00
0000-00
How TBM Excavation Works in Rock and Soft Ground: A Practical Guide - 00
0000-00
Choosing a Zero-Emission Underground Equipment Supplier: What to Check - 00
0000-00
Construction Starts on Germany's Pfaffensteig Rail Tunnel, With Two TBMs Planned - 00
0000-00
How Real-Time Underground Mapping Systems Work in Tunneling - 00
0000-00
First Mechanized Tunnel Crossing Beneath the Panama Canal Completed
Weekly Insights
Stay ahead with our curated technology reports delivered every Monday.