How Can a Tunnel Automation Data Platform Improve Project Visibility and Control?





A tunnel project can appear to be on schedule in the weekly report while the field is already showing signs of drift: cutterhead penetration is falling, a conveyor stoppage has created a hidden backlog, segment supply is tightening, or a safety exclusion zone has delayed a planned intervention. By the time these signals are consolidated manually, the shift has changed and the recovery options may be narrower.
A tunnel automation data platform improves visibility and control by bringing machine, production, maintenance, safety, logistics, and schedule information into a common operating view. Its value is not simply displaying more dashboards. It helps project leaders connect a field event to its likely impact, assign ownership faster, and verify whether corrective actions are restoring the plan. For complex underground works, that connection is what turns raw operational data into usable project control.
Why tunnel visibility breaks down even when data is available
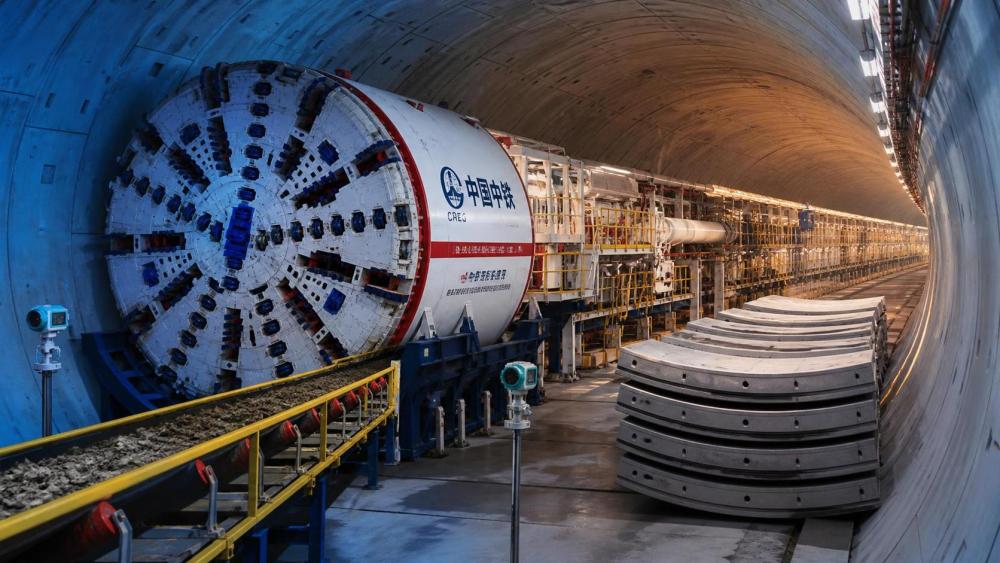
Most mechanized tunnelling projects already generate substantial information. A tunnel boring machine records thrust, torque, penetration, advance rate, cutterhead rotation, hydraulic conditions, screw conveyor behavior, and many other signals. Survey teams provide alignment and settlement information. Maintenance systems record inspections and component changes. Site supervisors track labor, segments, grout, muck handling, and access constraints.
The difficulty is that these records often sit in separate places and operate on different time horizons. Machine telemetry may be available by the minute, maintenance reports by shift, material records daily, and schedule updates weekly. A project manager trying to understand a production shortfall may need to compare several systems, spreadsheets, radio updates, and supervisor notes before reaching a defensible conclusion.
This fragmentation produces familiar problems:
- A machine slowdown is treated as an isolated equipment issue, although it may be caused by face conditions, segment handling delays, restricted spoil removal, or planned access work.
- Daily advance targets are reviewed without enough context to distinguish unavoidable ground-response adjustments from avoidable operational losses.
- Maintenance work is reported as completed, but its effect on availability, repeat alarms, and upcoming production commitments is unclear.
- Schedule forecasts are based on historical averages that no longer reflect current geology, logistics constraints, or recovery activities.
- Teams lose time debating which number is correct instead of deciding what should happen next.
A connected data environment does not eliminate uncertainty underground. Rock mass behavior, water ingress, wear, and access limitations will still create changing conditions. It does, however, make uncertainty visible earlier and ties it to operational decisions.
Start with the decisions that require better control
Projects sometimes begin by asking which sensors, reports, or dashboards should be added. That approach can create an attractive interface without improving decisions. A more useful starting point is to identify the recurring decisions that are currently delayed, disputed, or made with incomplete information.
For example, a project may need clearer evidence to answer questions such as: Is reduced advance caused by geology or by operational interruptions? Can the next planned maintenance window be deferred without raising risk? Will segment deliveries support the planned ring-build rate? Is the recovery plan working across several shifts? Does a trend in cutterhead load justify changing operating parameters or planning an inspection?
Once those decisions are defined, the required data becomes clearer. The platform should not attempt to collect every possible field signal on day one. It should first make the information needed for high-consequence or high-frequency decisions available in a consistent form.
Build one operational picture without flattening the details
A useful platform creates a shared view, but it should not reduce every issue to a red, amber, or green status. Tunnel operations require enough detail for specialists to investigate a problem while giving project leadership a concise view of impact and priority.
At the management level, the operating picture may show planned versus achieved progress, active constraints, machine availability, critical maintenance actions, material readiness, and schedule exposure. From there, a user should be able to move into the underlying shift data, alarms, event notes, or trend history. This drill-down matters because a headline such as “low productivity” is not actionable until the team can see whether the loss occurred during excavation, ring build, muck removal, planned maintenance, or a safety hold.
Time alignment is equally important. Different data sources should be normalized to a shared clock and shift structure. Without this, an equipment alarm may seem unrelated to a production interruption simply because one system records local machine time while another uses a reporting cutoff. Clear definitions for “operating,” “available,” “stopped,” “planned downtime,” and “unplanned downtime” are just as important as the software connection itself.
Turn downtime records into a control process
Downtime coding is often one of the first areas where project visibility can improve. Yet it also fails easily when categories are too broad, too numerous, or inconsistently applied. A shift team under pressure cannot be expected to navigate a long list of nearly identical codes while managing a live underground operation.
Use a small, practical hierarchy. The first level should distinguish major sources of lost production, such as ground-related restrictions, mechanical or electrical issues, planned maintenance, segment or logistics delays, survey and guidance activities, access constraints, and safety-related holds. A second level can capture more specific causes when they are useful for repeated analysis.
The goal is not to assign blame to a department. It is to determine whether the loss can be prevented, reduced, scheduled more effectively, or absorbed by the programme. A platform should allow the event record to include the duration, location or system affected, supporting evidence, responsible follow-up, and status of the corrective action. When the same type of interruption recurs, managers can see its accumulated schedule effect rather than treating each event as a separate inconvenience.
Review patterns, not just shift totals
A single lost shift may have a straightforward explanation. Repeated short stops are harder to detect and can be more damaging over time. Conveyor resets, segment handling interruptions, sensor faults, communications dropouts, or recurring pressure adjustments may each appear minor in isolation. Trend views can reveal whether these events cluster by shift, operating mode, ground chainage, equipment condition, or crew interface.
That pattern is often more useful than an average advance rate. An average can hide a stable operation interrupted by a few major events, or a constantly unstable operation that happens to reach the same overall output. Those require different responses.
Connect machine condition to the production plan
Equipment monitoring is most valuable when it changes planning behavior. A maintenance system may indicate repeated alarms or an overdue inspection, but the project impact remains unclear unless that information is connected to the upcoming excavation sequence, available maintenance windows, spare parts status, and recovery commitments.
Consider a machine showing a gradual change in torque, vibration, hydraulic temperature, or cutterhead performance. None of these signals alone proves a fault. Their meaning depends on ground conditions, operating parameters, recent interventions, and expected machine behavior. The platform should therefore present trend context rather than trigger an automatic conclusion.
Project control improves when teams can ask: Has this condition changed relative to similar ground? Is the signal accompanied by more frequent stoppages? Are related alarms increasing? Is an inspection already scheduled? What production milestone would be affected if the intervention expands? These questions support a planned response instead of waiting for an unplanned breakdown to dictate the schedule.
The same principle applies to supporting systems. Backup gantries, conveyors, ventilation, dewatering, grout plants, power supply, segment transport, and communications infrastructure can all become production constraints. A tunnel automation data platform should represent these dependencies where they affect the workface, not treat the TBM as the only source of operational risk.
Use schedule integration carefully
Linking live field data with programme milestones is powerful, but it should be done with discipline. Real-time information does not automatically create a reliable forecast. The forecast must still reflect logic, remaining quantities, access conditions, planned interventions, contractual milestones, and realistic recovery capacity.
A strong approach is to connect short-interval production plans with the master schedule. The near-term plan may cover rings, meters, headings, planned maintenance, segment deliveries, and logistical constraints over the next several shifts or weeks. Actual performance can then update the assumptions behind that plan. When progress diverges, the project team can see whether the gap is temporary, cumulative, or likely to affect a critical milestone.
Do not use the platform to create false precision. In variable ground, a forecast should show assumptions and confidence limits rather than imply that every remaining meter can be predicted exactly. The value lies in exposing the assumptions early: expected advance rate, allowable downtime, maintenance duration, material availability, and dependencies on adjacent works.
Implementation choices that determine whether teams trust the system
Trust is earned through data quality and practical workflow design. A platform that presents inconsistent production totals or unexplained sensor values will quickly be bypassed in favor of informal spreadsheets and verbal updates. Before scaling up, establish who owns each dataset, how it is validated, and how corrections are recorded.
Several implementation decisions deserve early attention:
- Define the operating vocabulary. Agree on shift boundaries, downtime definitions, progress units, equipment states, and the meaning of key performance indicators.
- Map data sources and gaps. Identify what comes from machine control systems, maintenance records, survey data, logistics tracking, manual shift reports, and safety processes. Do not assume all sources have the same reliability or update frequency.
- Begin with a limited control use case. A good first use case might be production-versus-plan review, recurring downtime analysis, or maintenance coordination. Demonstrated usefulness encourages accurate input.
- Preserve field context. Allow supervisors and engineers to attach concise notes to events. A data trace without operational context can lead to incorrect interpretation.
- Set role-based access. Different users need different levels of detail, but teams should work from the same governed definitions rather than separate unofficial reports.
- Review exceptions routinely. The platform should support a regular operating rhythm: identify deviations, assign actions, confirm completion, and test whether the action changed the trend.
Integration also needs sensible boundaries. Some data may be valuable for engineering analysis but unnecessary for daily project control. Other information may require restricted access because it relates to safety investigations, personnel records, or sensitive commercial planning. A practical design brings together what is needed for decisions while retaining appropriate governance.
What better control looks like in daily operations
The clearest sign of improvement is not a larger dashboard. It is a shorter path from signal to decision. At shift handover, teams can see the current production position, unresolved stops, machine condition concerns, material constraints, and tasks that could affect the next work period. During the week, managers can distinguish a one-off disruption from a developing trend. At planning meetings, schedule discussions rely less on competing versions of progress and more on shared operational evidence.
For project leaders, the platform becomes a structured way to challenge assumptions. A recovery plan may look achievable on paper, but the connected record may show that it depends on reducing a recurring logistics delay, completing a maintenance task within a narrow window, or sustaining performance that current conditions do not support. That visibility does not make the decision easier, but it makes the risk explicit while there is still time to act.
In underground construction, control is rarely about eliminating every variance. It is about recognizing which variance matters, understanding its operational cause, and directing attention before it becomes a schedule, cost, equipment, or safety problem.
Related News
How to Evaluate European Drill-and-Blast Tunnelling Contractors for Complex Projects
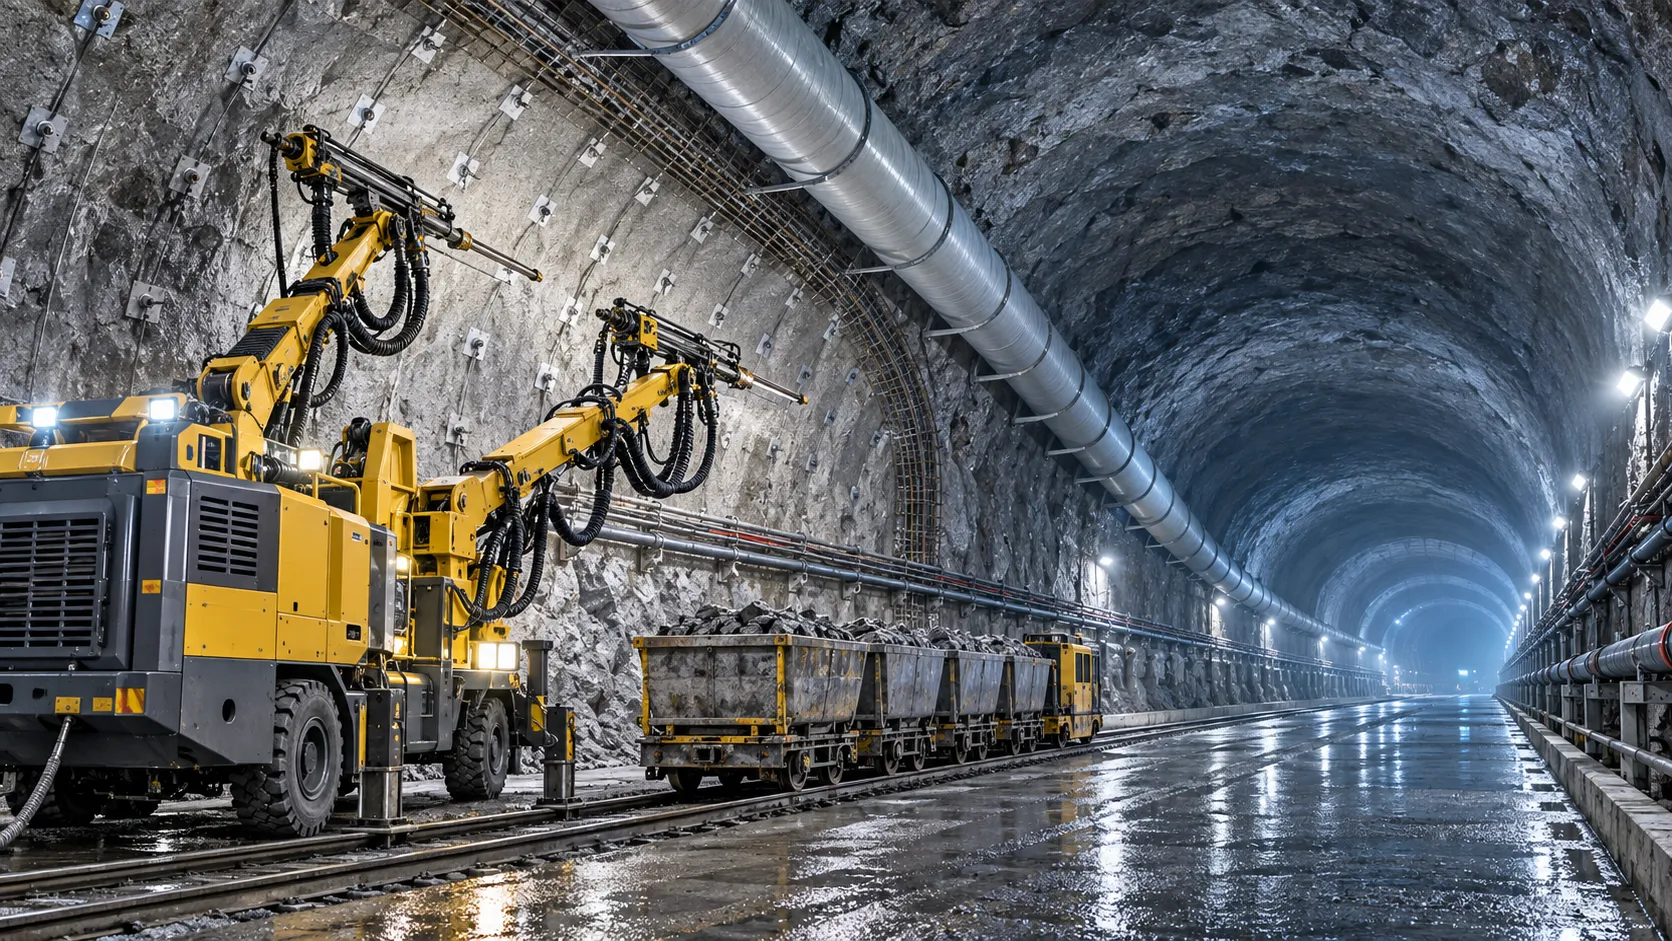
Drill and blast tunnelling contractors Europe: learn how to assess geology expertise, blast control, equipment reliability, safety, and programme resilience for complex projects.
Which Trenchless Construction Technique Fits Your Utility Crossing Conditions?
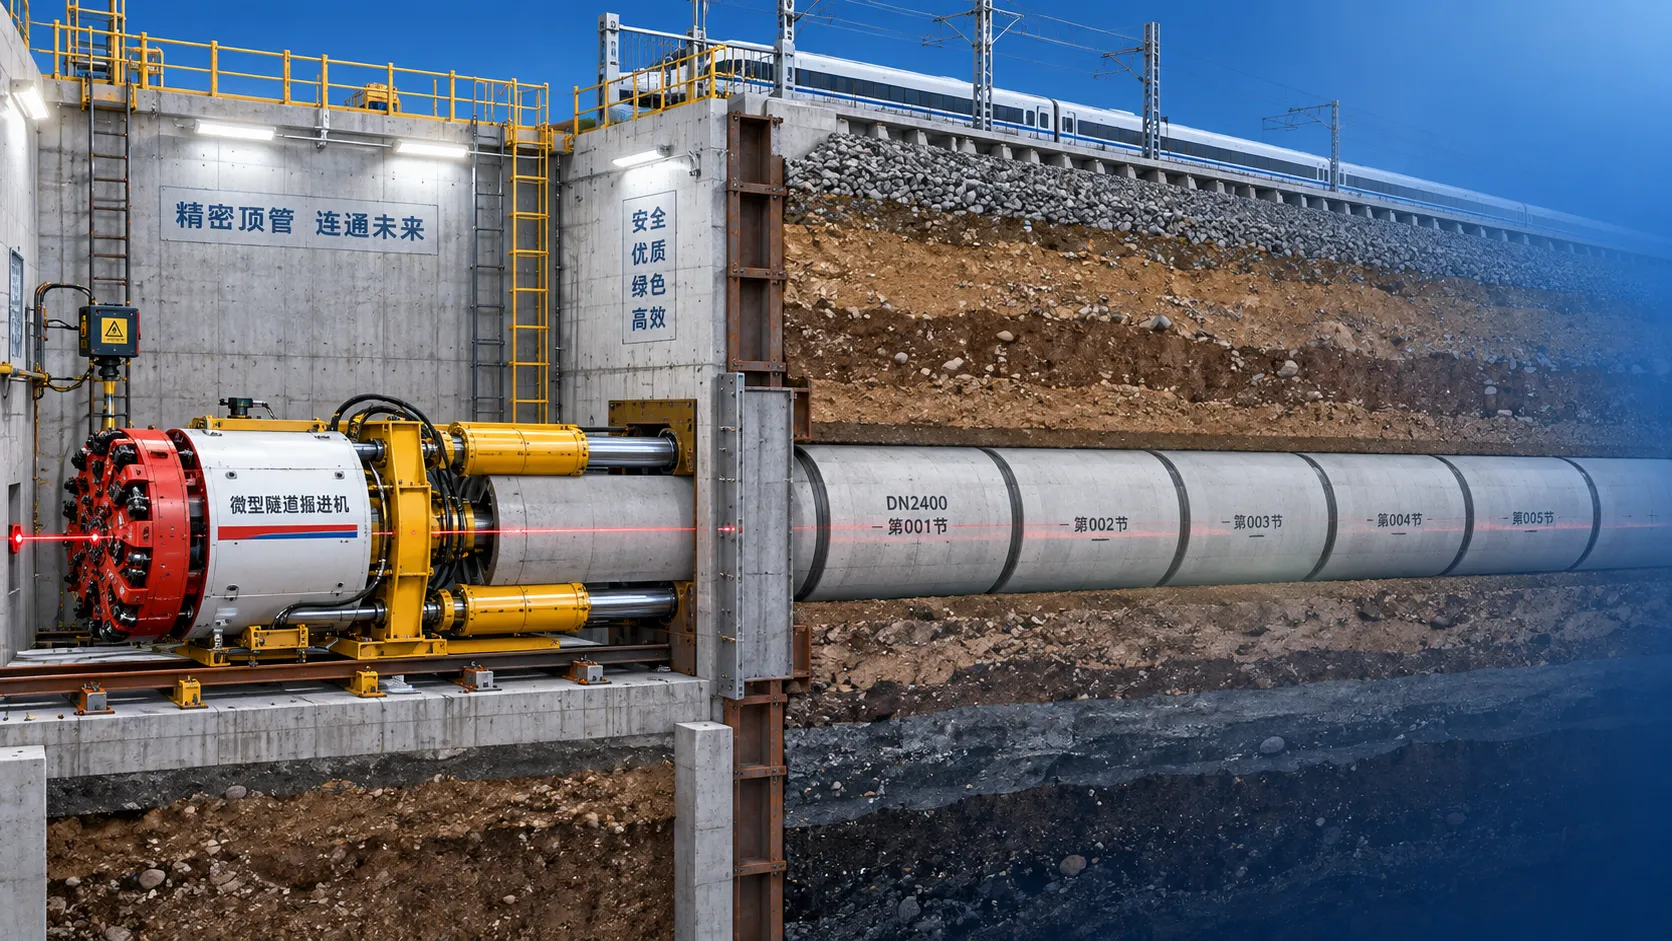
Trenchless construction techniques compared for utility crossings: choose HDD, microtunnelling, pipe jacking, or auger boring based on ground, accuracy, access, and risk.
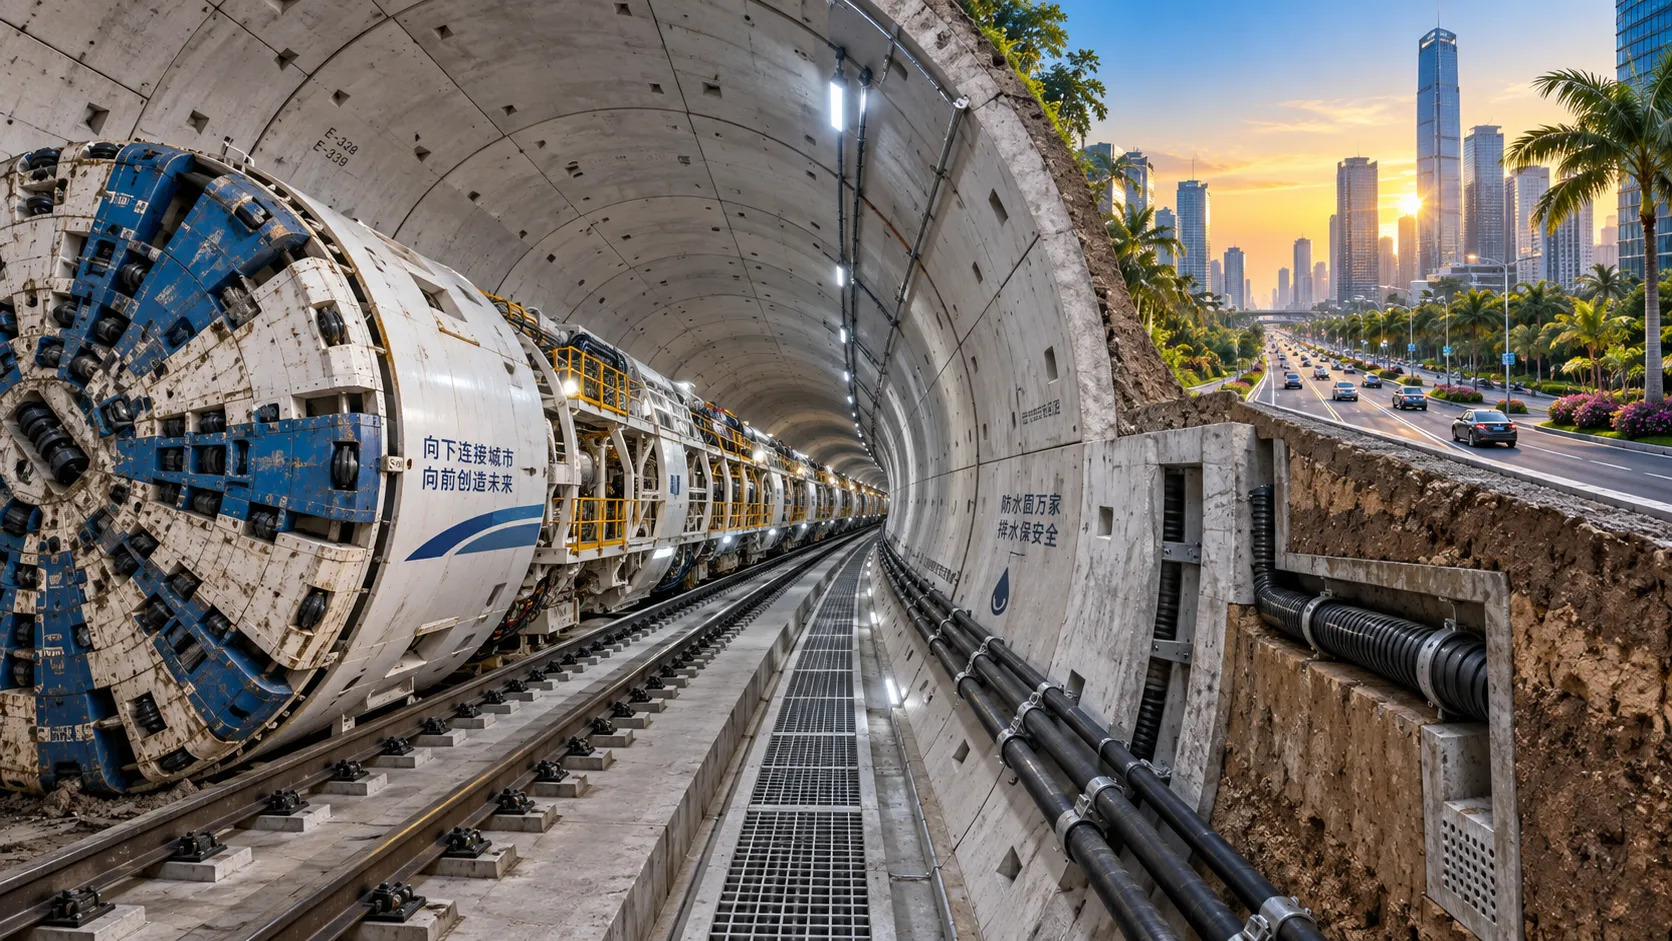
What Is Driving Metro Tunnelling Demand Across Southeast Asia’s Major Cities?
Metro tunnelling Southeast Asia is accelerating as major cities tackle congestion, flooding, and connectivity. Explore the market forces, technical risks, and opportunities shaping demand.
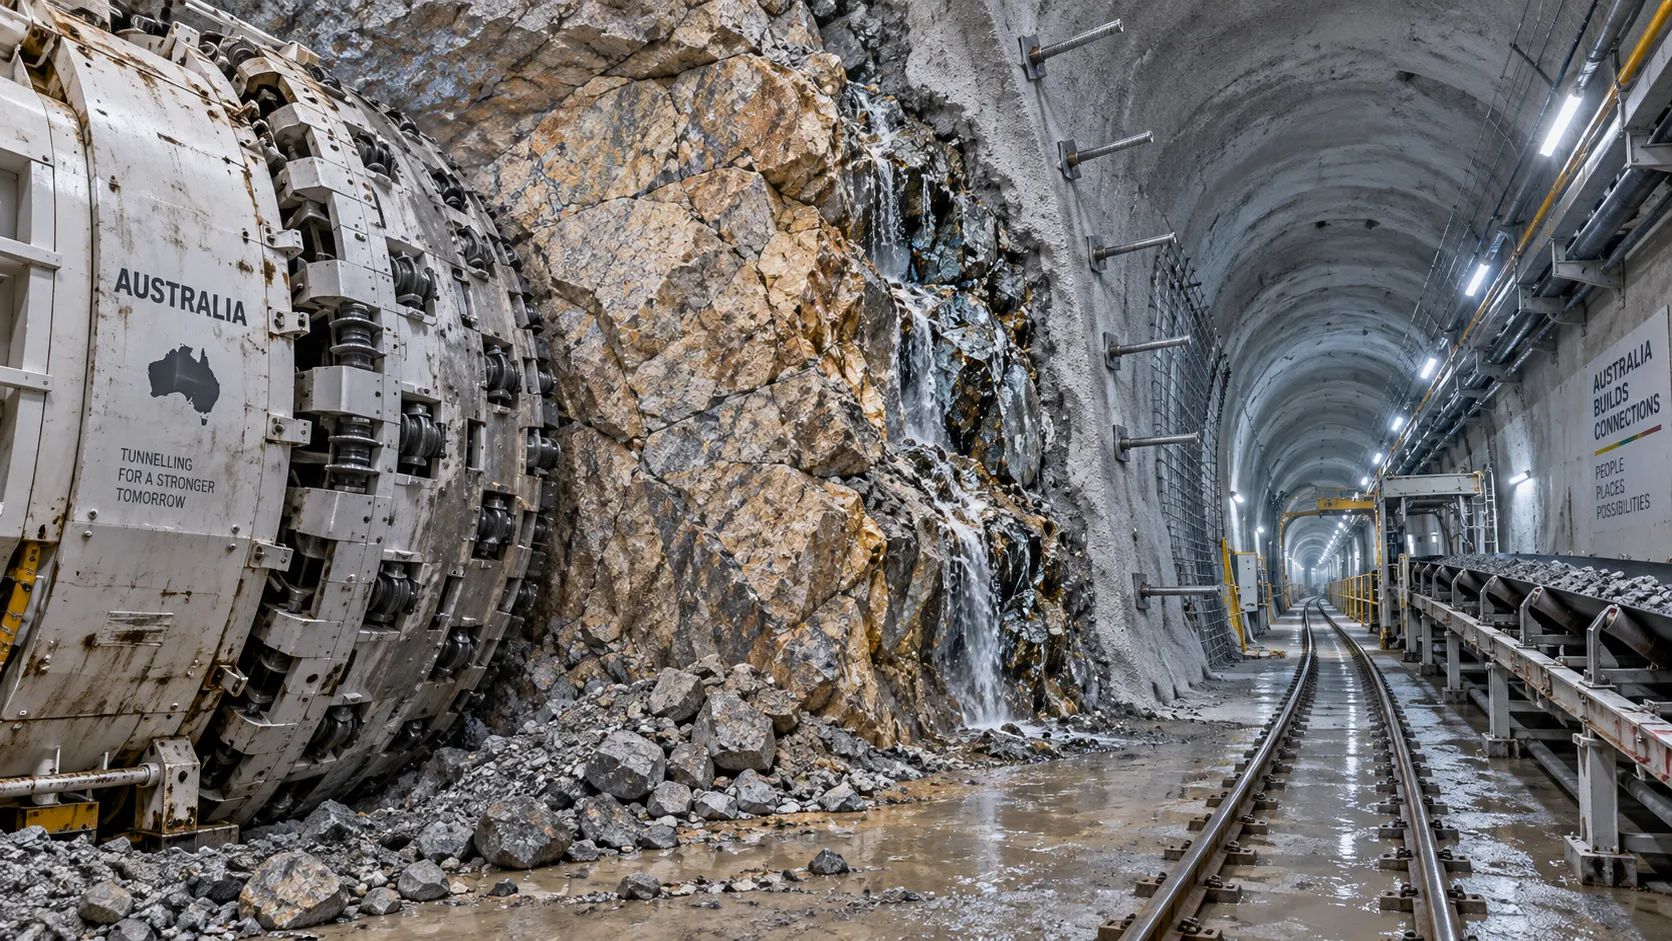
Hard Rock Tunnelling in Australia: Selecting Methods for Variable Ground Conditions
Hard rock tunnelling in Australia: compare TBM, drill-and-blast and hybrid methods to manage variable ground, reduce risk and protect project costs.
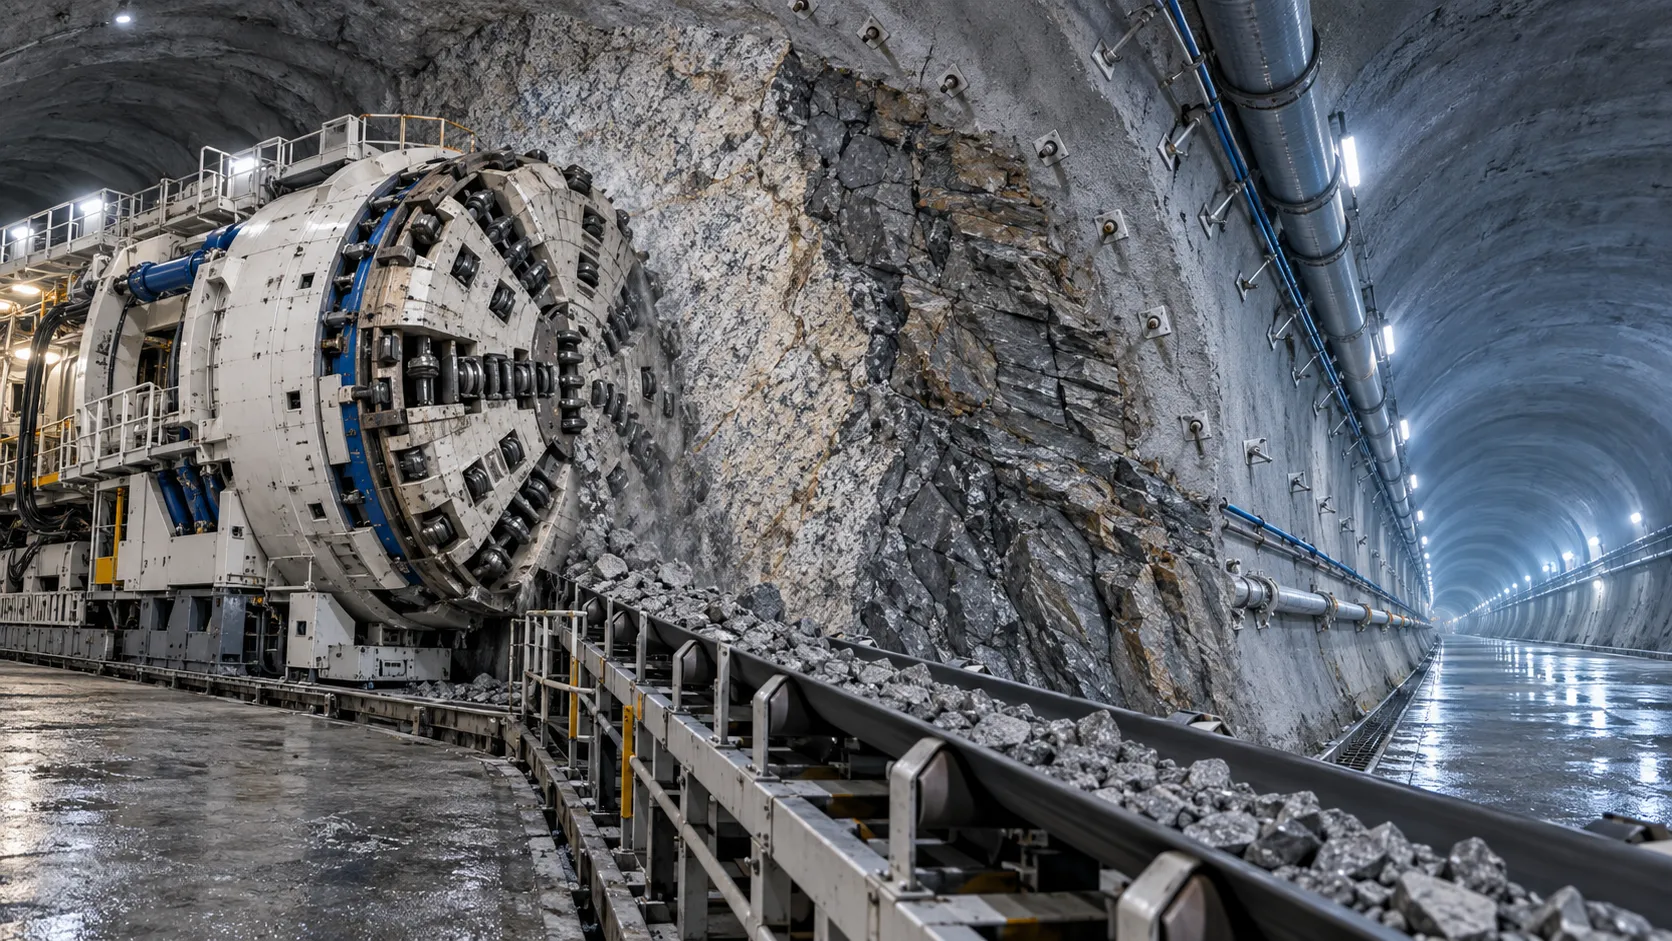
Hydropower Tunnel Excavation: Selecting Methods for Variable Rock Conditions
Hydropower tunnel excavation methods for variable rock conditions: compare TBM, drill-and-blast, and hybrid strategies to improve safety, progress, and project control.
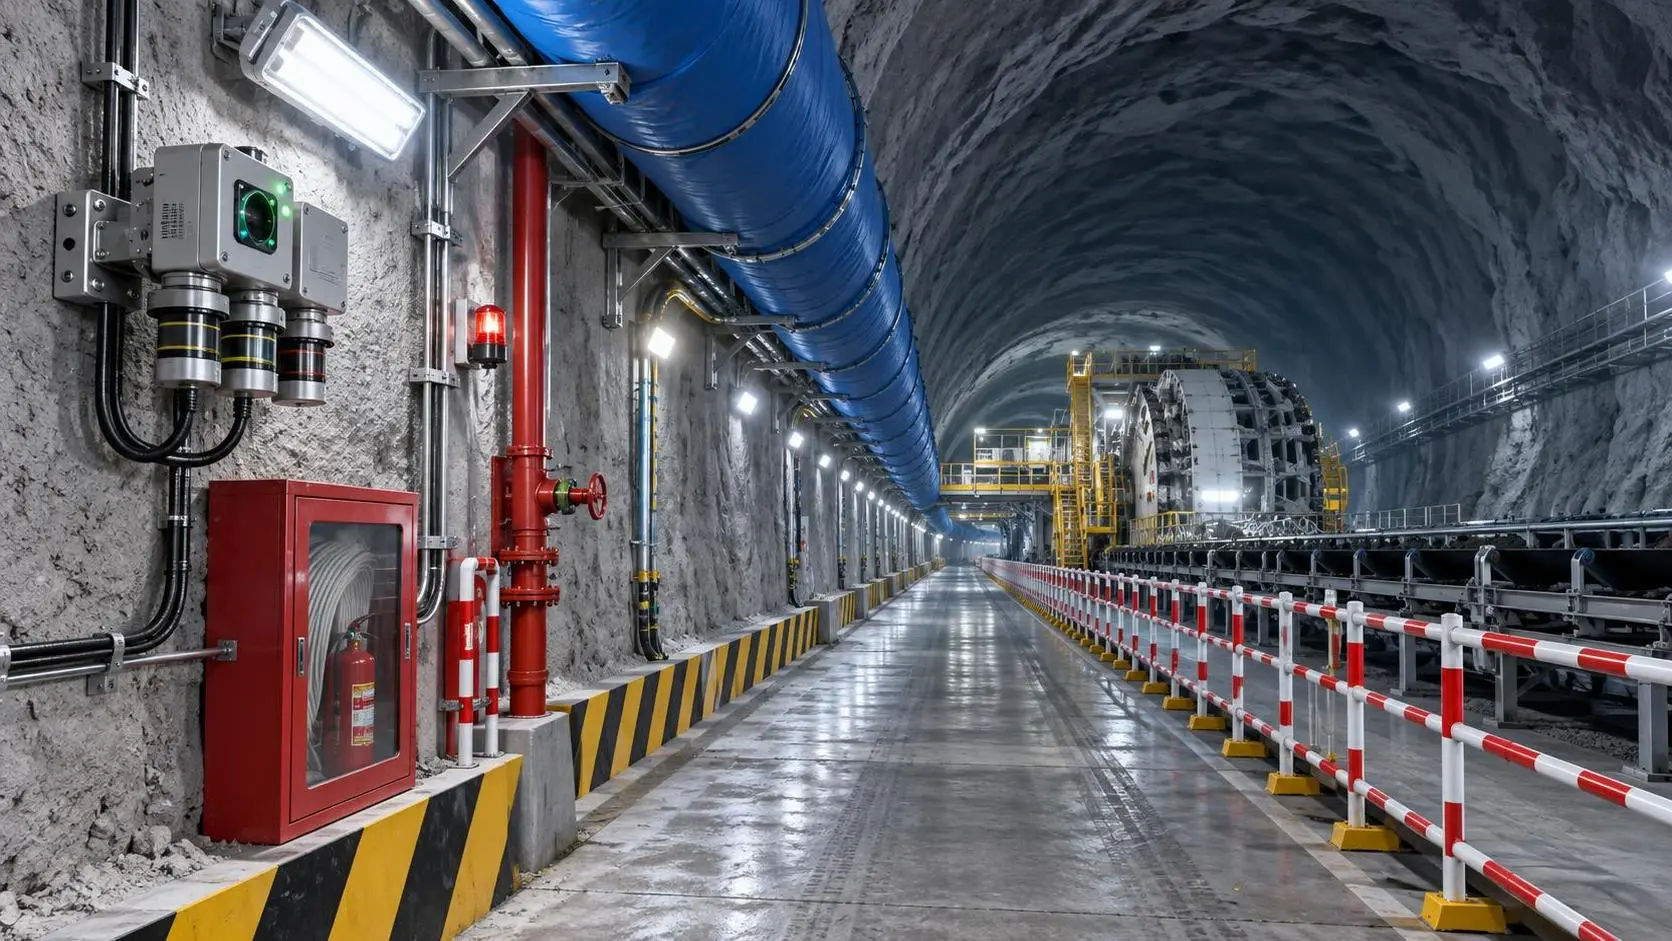
How to Select Underground Safety Equipment for Tunnelling by Hazard and Work Zone
Underground Safety Equipment for tunnelling: match protection to hazards, work zones, compliance, and emergency needs with this practical selection guide.
EPB or Slurry Shield? Selecting Soft-Ground Tunnelling Equipment by Soil Conditions
Tunnel Excavation Equipment for soft ground: compare EPB and slurry shields by soil, groundwater, settlement risk, and project logistics to choose confidently.
How to Specify TBM Backup System Parts for Reliable Long-Distance Tunnelling
TBM backup system parts: learn how to specify reliable spares for long-distance tunnelling, reduce downtime, ensure compatibility, and speed underground recovery.

How to Size Open Pit Mining Trucks for Haul Distance, Grade, and Payload?
Open Pit Mining Trucks: learn how to match payload, haul distance, grade, road resistance, and loading capacity for safer, lower-cost mine operations.
Related News
- 00
0000-00
How to Evaluate European Drill-and-Blast Tunnelling Contractors for Complex Projects - 00
0000-00
Which Trenchless Construction Technique Fits Your Utility Crossing Conditions? - 00
0000-00
What Is Driving Metro Tunnelling Demand Across Southeast Asia’s Major Cities? - 00
0000-00
Hard Rock Tunnelling in Australia: Selecting Methods for Variable Ground Conditions - 00
0000-00
Hydropower Tunnel Excavation: Selecting Methods for Variable Rock Conditions
Weekly Insights
Stay ahead with our curated technology reports delivered every Monday.