
Open-Pit Haulage Cost Analysis: How Mine Managers Can Cut Cost per Tonne





Reducing open-pit haulage cost is not primarily a matter of buying a larger truck, negotiating a lower fuel price, or demanding faster cycles from operators. Cost per tonne falls when the mine controls the interaction between payload, travel resistance, loading performance, equipment availability, road condition, and dispatch discipline. A truck fleet can appear productive on a shift report while still producing an expensive tonne because it is carrying under-payloads, queueing at shovels, burning fuel on poor grades, or losing hours to avoidable maintenance stops.
An effective open pit haulage cost analysis therefore needs to separate the visible cost of moving material from the operational conditions that create it. The relevant question is not simply “What does each truck cost per hour?” It is “What does it cost to deliver one usable tonne to the planned destination, at the required production rate, under the actual road and loading conditions of this pit?”
Use a cost-per-tonne model that exposes operational loss
The basic calculation is straightforward:
Haulage cost per tonne = Total haulage cost for the period ÷ Tonnes delivered for the period
Its usefulness depends entirely on what sits behind both sides of the equation. Total haulage cost should normally include direct truck operating costs, labour, fuel or electricity, tyres, maintenance labour and materials, dispatch and support functions that are dedicated to haulage, road maintenance where material movement depends on it, and an appropriate allocation for fleet ownership or lease cost. Delivered tonnes should be reconciled against reliable payload measurement and destination records, not only loader estimates or planned production figures.
A single monthly average can hide the reason for poor performance. Break the result down by at least material type, loading unit, route, destination, truck class, and shift where the mine has dependable data. Waste hauled uphill to an external dump may have a very different cost structure from ore sent downhill to a crusher, even when the distance is similar. A blended mine-wide number is useful for finance reporting; it is too blunt for operational intervention.
For each route, the management view should connect cost with the physical work being performed:
- tonnes per truck operating hour;
- average payload and payload distribution;
- loaded and empty travel times;
- queue, spotting, loading, dumping, and delay time;
- fuel or energy consumed per tonne and per operating hour;
- mechanical availability and utilization;
- road grade, rolling resistance, and distance evolution.
These measures should not be treated as independent scorecards. A reduction in cycle time that raises tyre damage or causes payload variation may not improve delivered cost. Likewise, high truck utilization is not necessarily good if the fleet is being utilized in queues rather than in productive travel.
Payload is often the fastest route to a lower cost per tonne—within limits
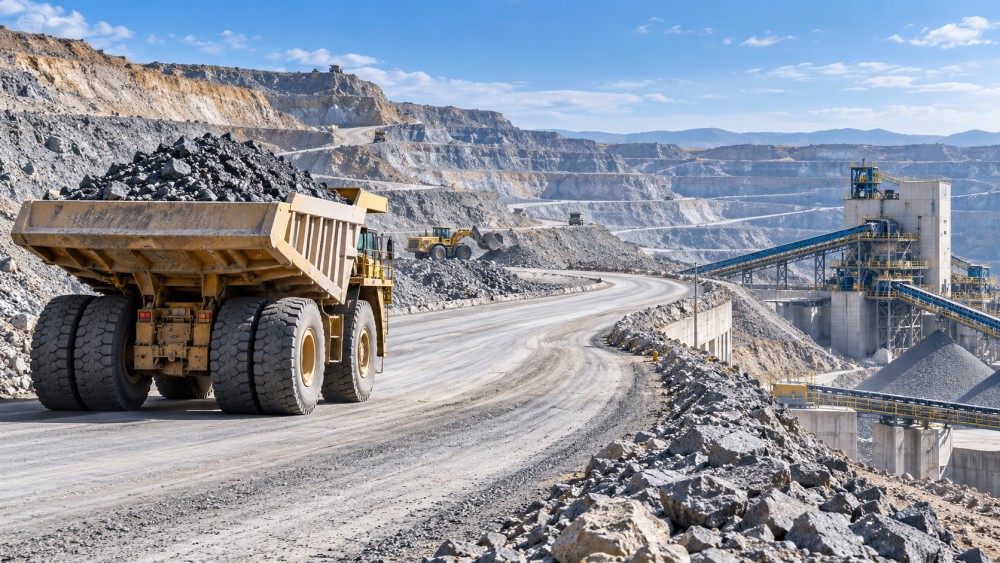
Every underloaded trip spreads nearly the same fixed hourly truck cost across fewer tonnes. The effect can be substantial because diesel or battery energy, operator time, depreciation, maintenance exposure, and tyre wear continue while the truck completes the same route. Persistent underloading may indicate an inaccurate loading target, inconsistent bucket fill, poor fragmentation, loading-tool mismatch, or a dispatch system that does not provide timely payload feedback.
Overloading is not the cure. It may accelerate tyre wear, increase structural and suspension loading, affect braking margins, reduce speed on grades, and create safety or compliance concerns. It also introduces variability: an average payload near target can conceal a distribution containing both chronic underloads and damaging overloads.
The practical control point is the payload distribution, not merely the average payload. A useful review asks how many loads fall within the agreed operating window for each truck and material class, how frequently overload events occur, and whether individual loaders or shifts show a repeatable bias. The operating window should reflect the truck manufacturer’s payload rating, site-specific conditions, tyre limits, road geometry, and the mine’s maintenance strategy. A nominal payload target detached from these constraints is not a cost-control tool.
Loader-truck matching matters here. A loading unit that requires too many passes increases load time, introduces more opportunities for bucket inconsistency, and can raise queueing. Too few passes can make accurate loading difficult, particularly with variable-density material. The right match is not defined by bucket-to-body volume alone; material density, swell, bucket fill factor, fragmentation, and the achievable payload precision all matter.
Cycle time must be decomposed before it can be improved
A truck cycle contains loading, spotting, loaded haul, dumping, empty return, and all forms of waiting or delay. Treating the entire cycle as one number leads to generic instructions to “improve efficiency.” Decomposing it identifies whether the constraint is at the face, on the road, at the dump, or in the coordination between assets.
Queue time at a loading unit often points to a truck-to-shovel balance problem, but the answer is not automatically to add trucks. The loading unit may be losing effective digging rate because of poor face preparation, difficult dig conditions, operator changeovers, or frequent relocations. Adding trucks to an unstable loading point can increase fuel burn and congestion while leaving tonnes per hour unchanged.
Queue time at the crusher or dump can arise from limited tipping capacity, traffic rules, poor dump management, crusher availability, or poor sequencing of truck arrivals. Where dump locations move frequently, route design and dumping discipline deserve the same attention as truck performance. A short delay repeated across every cycle can produce a large cost effect over a shift, especially in a large fleet.
Travel time needs further separation. Compare actual loaded and empty speed profiles with the road design and operating limits, rather than using only average speed. Slow travel may be appropriate on steep grades, curves, wet surfaces, or congested sections. It becomes a cost problem when it is caused by rutting, corrugation, loose material, inadequate drainage, poor intersection design, or an avoidable mismatch between route condition and truck specification.
Haul roads are an operating asset, not an indirect support cost
Road condition influences fuel consumption, speed, tyre heat, suspension loading, structural fatigue, and operator fatigue at the same time. Deferring road maintenance may look like a short-term saving in a departmental budget while increasing the mine’s cost per tonne through slower cycles, higher repair demand, and reduced equipment availability.
Rolling resistance is particularly important because it converts directly into the force required to move the truck. Loose, rough, soft, or poorly drained surfaces increase resistance; water management failures can quickly turn a planned route into a high-cost route. Grade also changes the energy profile. A route with a longer distance but improved grade and better running surface can be economically preferable to a shorter, rougher alternative. That decision should be based on measured cycle, fuel or energy, and maintenance effects—not distance alone.
Road work should be prioritized by value at the bottleneck. A common mistake is to grade roads according to a fixed schedule without linking the work to traffic volume, route criticality, and measured resistance. The sections carrying the highest tonne-kilometres or generating recurring speed losses should receive attention first. This requires road-maintenance data to be visible in the same review as fleet data, not isolated in a separate function.
Fuel, electricity, and tyres should be analysed as route-dependent costs
Fuel consumption per engine hour is useful for detecting deterioration or abnormal operating behaviour, but it does not show the cost of moving material. Fuel per tonne and fuel per tonne-kilometre provide a better comparison between routes and truck classes. They should be interpreted alongside payload, grade, rolling resistance, idle time, and travel speed. A high fuel-per-tonne result can be caused by a poor road, low payload, extended idling, unsuitable gear selection, or a route change; it is not automatically an engine issue.
For electric or trolley-assist haulage options, the same discipline applies. Energy per tonne must be evaluated with charging or power-supply constraints, regenerative braking opportunities on descent, charging queue time, battery thermal conditions, and the production consequences of equipment downtime. Lower energy cost does not automatically mean lower haulage cost if the charging system constrains fleet availability or requires a larger fleet to sustain the same material movement.
Tyres merit separate attention because their cost is affected by payload, speed, road roughness, heat, maintenance practice, and tyre selection. A procurement decision based only on purchase price can be misleading. The relevant comparison is expected usable life and cost per tonne under the mine’s actual operating conditions, with adequate assurance of supply for the selected specification. A lower-priced tyre that cannot withstand the site’s heat, haul distance, or road condition may increase both direct spend and truck downtime.
Availability and utilization need different management responses
Mechanical availability measures whether a truck is physically capable of operating. Utilization indicates how much of that available time is actually used. A fleet may have good availability but poor utilization because of waiting, weather interruptions, shift-change losses, limited loading capacity, or dispatch problems. It may also show high utilization while availability falls, which can signal that too few trucks are being worked too hard.
Maintenance cost should be connected to failure modes and lost production time. Aggregate repair expenditure is insufficient for decision-making. Track recurring components, labour hours, planned versus unplanned maintenance, repeat defects, and the operational conditions before failure. If suspension, tyre, frame, or drivetrain events cluster on a particular route or truck group, the mine should investigate road condition, payload control, and operating practice alongside the component itself.
Fleet age is also not a standalone replacement trigger. An older truck can remain economically viable if its availability, fuel use, repair profile, and safety condition remain acceptable. Conversely, a newer unit can become expensive when it is poorly matched to the route, loading tool, workshop capability, or spare-parts supply chain. Replacement analysis should compare the full cost of retaining, rebuilding, leasing, or purchasing equipment over the planned mine schedule—not only the acquisition price or a single year of maintenance spending.
Dispatch data only creates value when it changes the operating plan
Fleet-management systems can provide detailed information on location, idle time, speed, payload, cycle segments, and exceptions. The risk is collecting more data than the operation can act on. A useful dispatch process focuses on exceptions that have a defined owner and response: a truck repeatedly arriving under target payload, a loading unit accumulating queues, a road segment creating abnormal travel time, or a crusher constraint causing truck stacking.
Real-time optimization also needs operating rules that people can trust. If dispatch assignments change frequently without accounting for operator breaks, road closures, loading-unit capability, material destination requirements, or maintenance status, the system can create disruption rather than productivity. The objective is not maximum reassignment. It is stable material flow with enough flexibility to respond to genuine constraints.
Production reconciliation is essential. Payload system readings, loader estimates, crusher feed records, and survey-based movement figures may not align exactly because they measure different points in the process. The gap should be understood before cost-per-tonne targets are used for performance accountability. Otherwise, teams can appear to improve haulage cost simply because the denominator has changed.
Procurement decisions should begin with the mine plan, not the truck brochure
Truck procurement is strongest when it follows a route-and-production model built from the expected mine plan. Required fleet capacity depends on annual and shift material movement, haul distances, grade development, loading-unit availability, dump and crusher capacity, road standards, weather exposure, and planned maintenance. The selected truck must also fit the loading fleet, workshop lifting and tooling capability, tyre strategy, fuel or charging infrastructure, parts inventory, and operator training requirements.
Quoted payload, engine power, battery capacity, or autonomous capability should be treated as inputs to a site model rather than as decision conclusions. A higher-capacity truck may reduce unit count but increase road-width requirements, loading-unit match constraints, tyre exposure, dump design requirements, and the consequence of an individual truck outage. A smaller class may provide better flexibility where faces and routes change frequently. Neither option is inherently lower cost without testing the complete production system.
Supplier evaluation should include more than purchase price and stated delivery date. Spare-parts lead times, local or regional technical support, warranty exclusions, diagnostic access, software support, component interchangeability, training, and the supplier’s ability to support the expected operating environment all affect lifecycle risk. For digitally connected or autonomous equipment, data ownership, cybersecurity responsibilities, integration with dispatch systems, and the continuity of software support require the same scrutiny as mechanical service terms.
The most durable cost reductions come from removing a verified constraint, not from applying a generic efficiency initiative. A mine that improves payload control but leaves road resistance untreated may see only a partial gain. A mine that buys additional trucks while the crusher remains the bottleneck may merely create queues. Cost per tonne becomes manageable when every major cost line is connected to a physical cause, a measurable operating condition, and a decision owner capable of changing it.
Related News
Tunnel Boring Machine Costs: Budgeting for Purchase, Operation, and Project Risk
Tunnel Boring Machines cost more than purchase price. Learn how to budget lifecycle costs, downtime, logistics, wear, and project risk for smarter TBM decisions.
Tunnel Construction Innovations That Reduce Risk and Schedule Delays on Urban Projects
Tunnel construction innovation for urban projects: discover smarter TBMs, real-time monitoring, trenchless methods, and automation that reduce risk and protect schedules.

TBM Disc Cutter Design: Key Geometry and Load Factors for Hard Rock Tunnelling
TBM disc cutter design explained: explore geometry, spacing, load distribution and maintenance factors for reliable, efficient hard-rock tunnelling performance.
Hydraulic Tipping Stability Risks in Multi-Axle Dump Special Trailers
Dump special trailers: discover key hydraulic tipping stability risks, multi-axle load dynamics, and practical safety controls for safer, smarter bulk hauling.
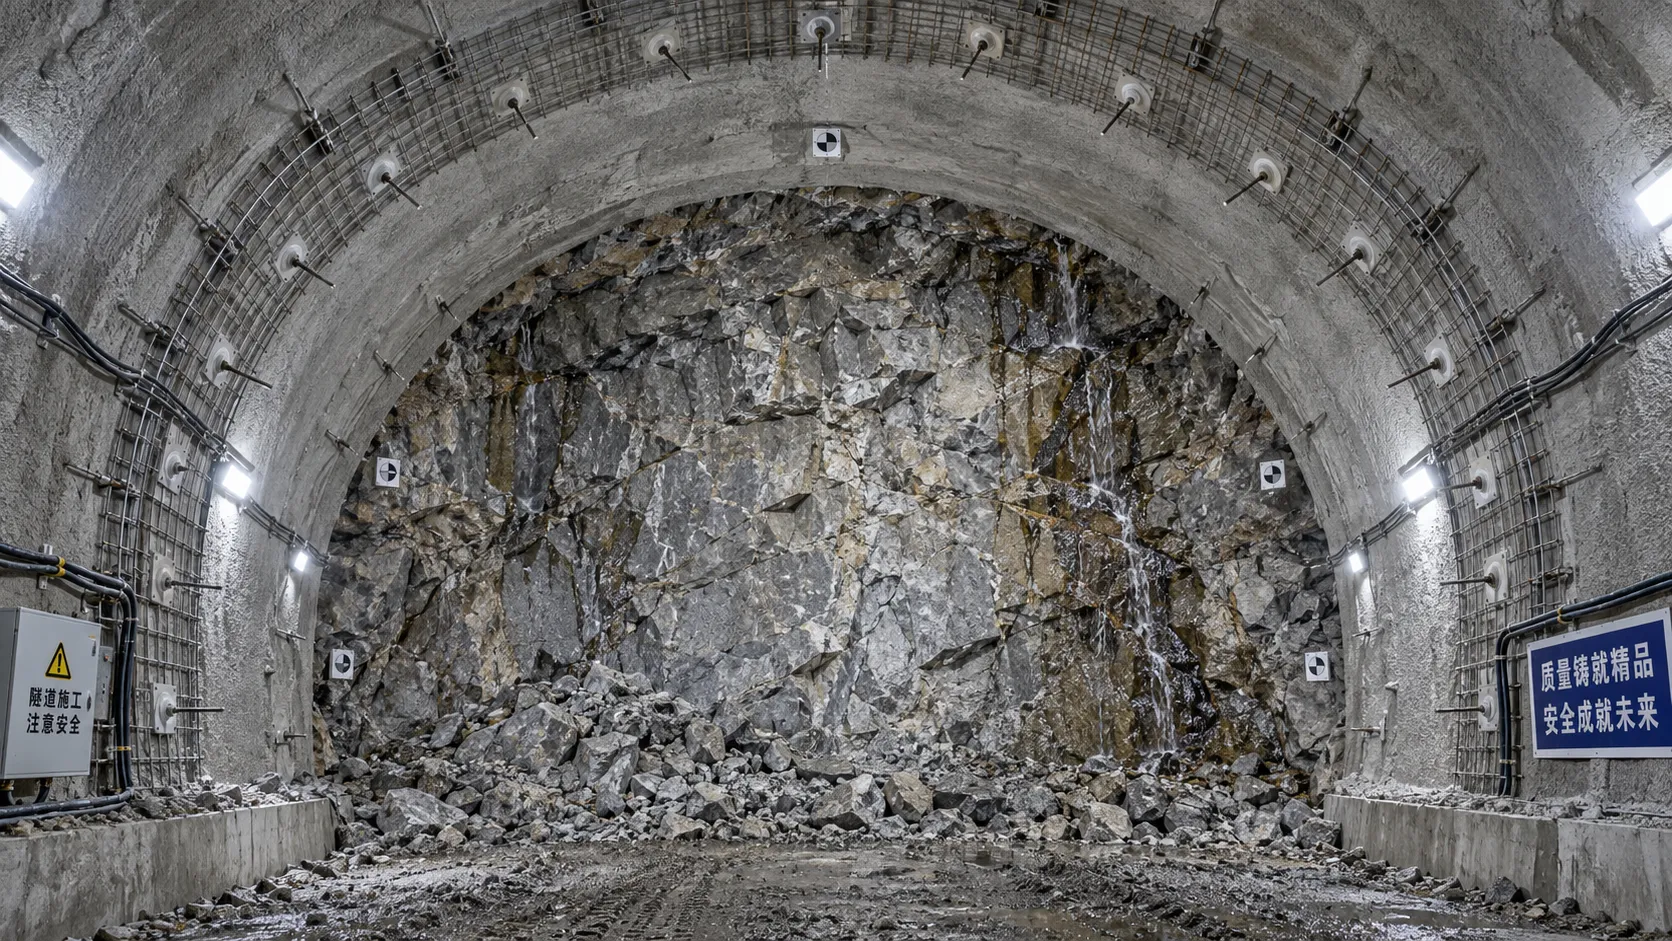
When rock reinforcement in tunnel construction must change after blasting
Rock reinforcement in tunnel construction must change when blasting reveals overbreak, weak joints, water inflow, or deformation. Discover key post-blast support decisions.
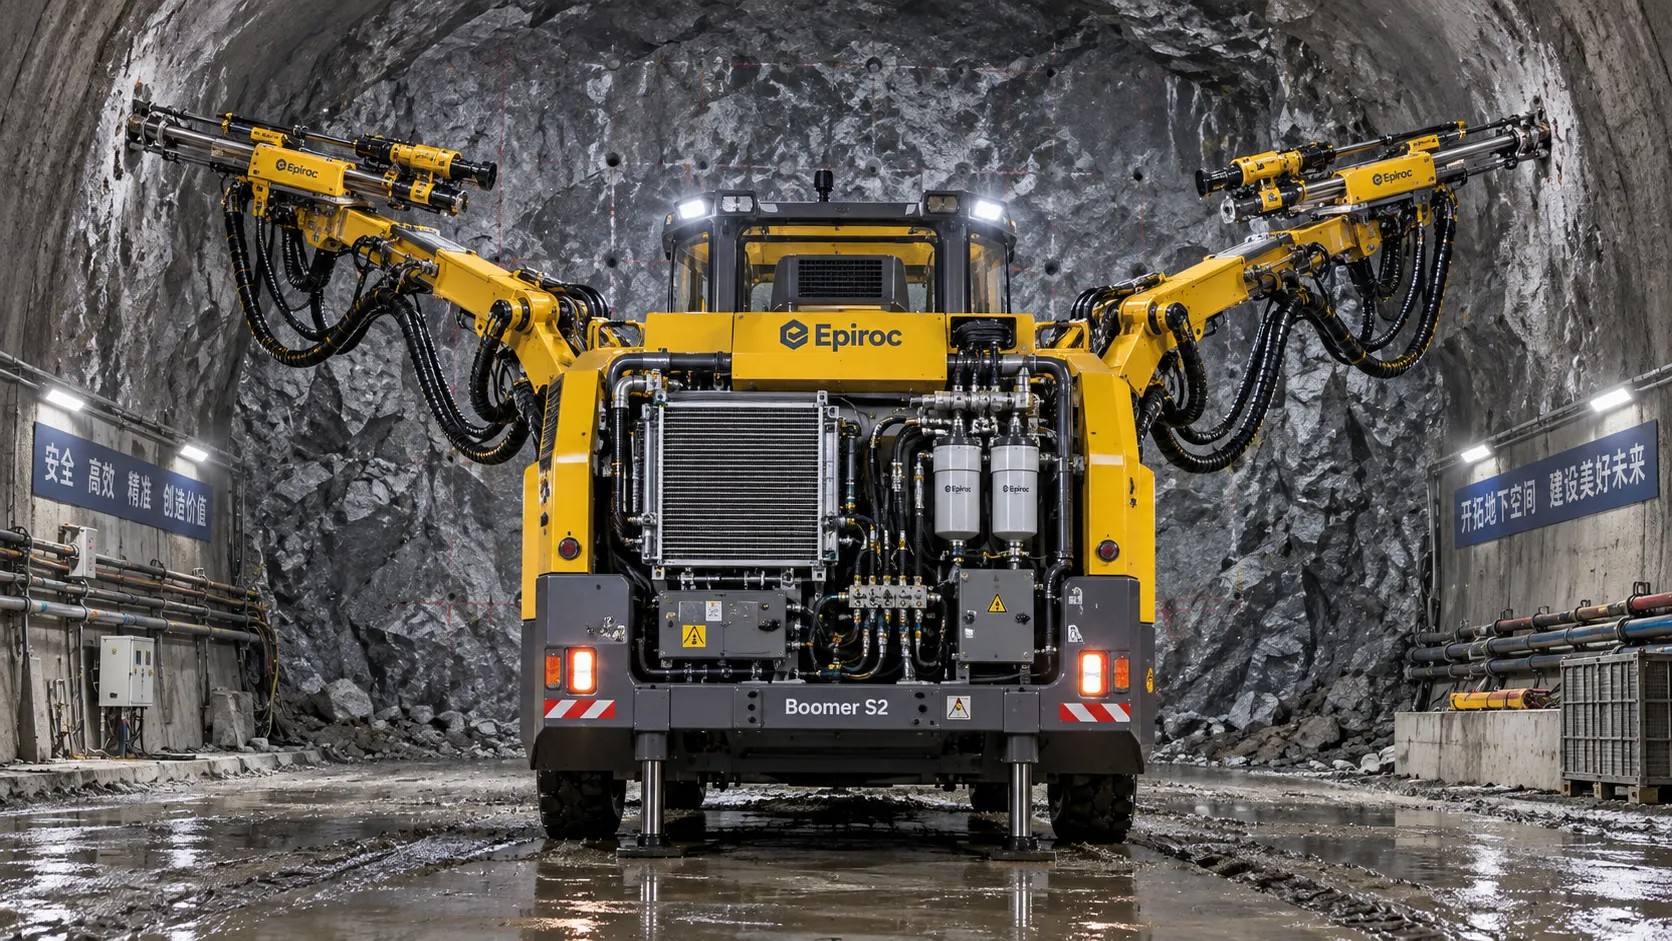
How tunnel hydraulic systems influence drill jumbo uptime underground
Tunnel hydraulic systems directly influence drill jumbo uptime. Explore how stable pressure, clean oil, cooling, and maintainable design reduce underground downtime.
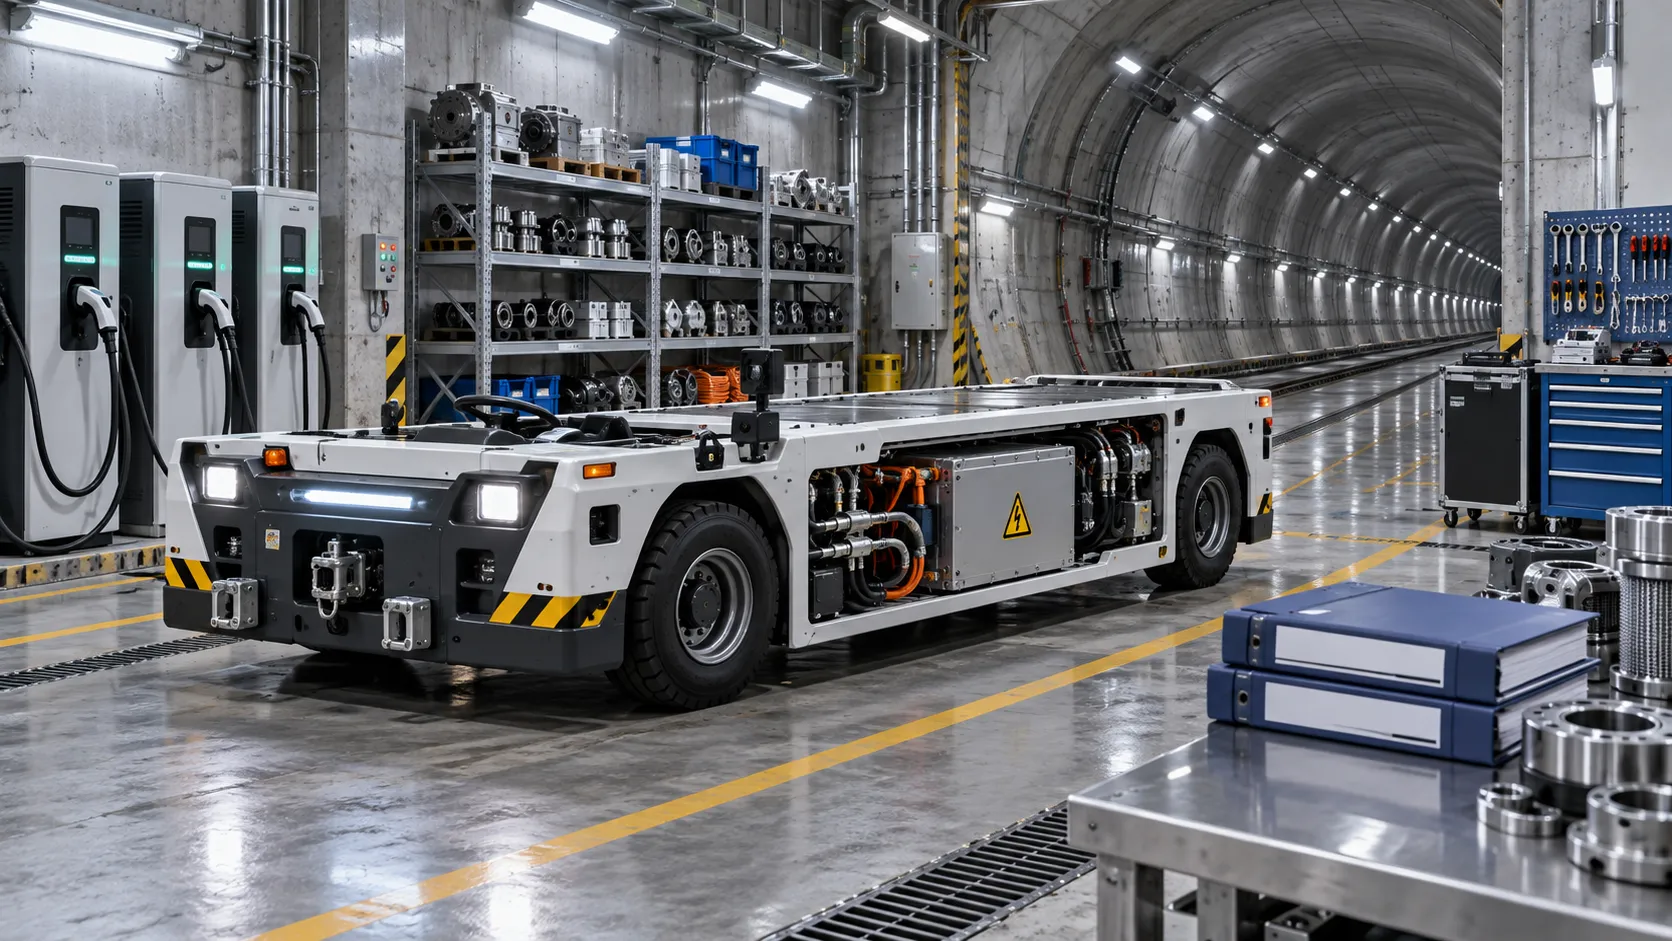
What to verify before appointing a tunneling vehicles manufacturer
Choosing a tunneling vehicles manufacturer? Verify application fit, reliability, compliance, parts support, training, and channel terms before appointing a partner.
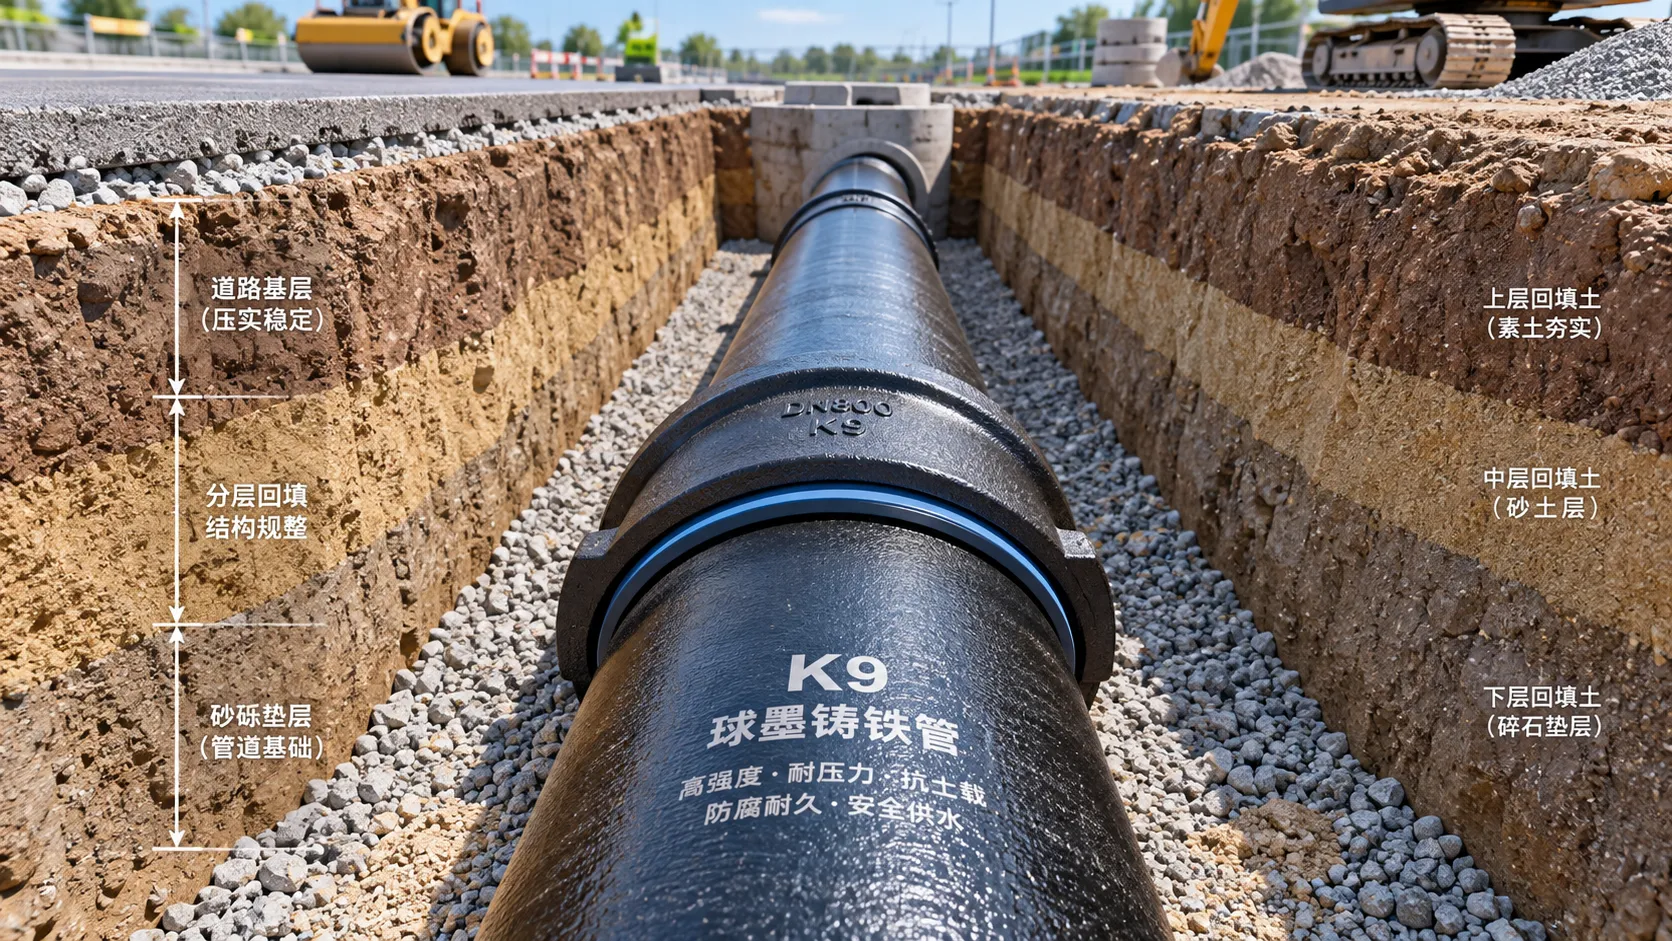
Selecting K9 Ductile Iron Pipe for Buried Water Pipeline Conditions
K9 ductile iron pipe selection for buried water pipelines: compare pressure duty, joints, soil loads, corrosion protection, and installation controls for reliable long-term performance.
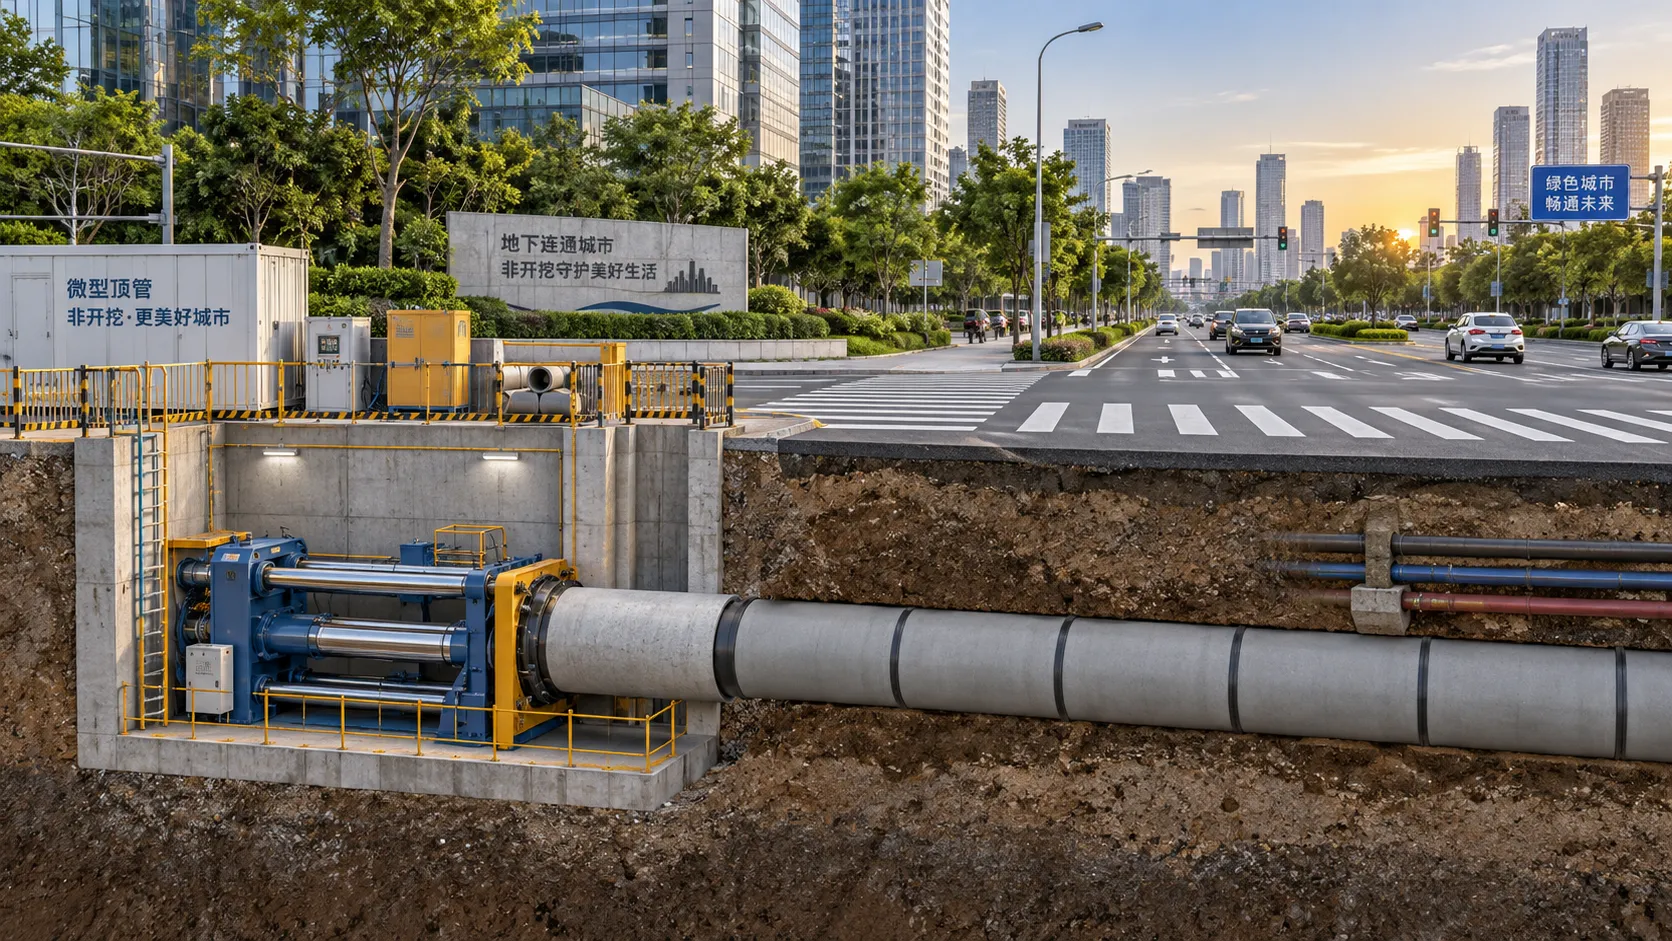
Where Trenchless Technology Delivers the Best Value in Urban Utility Projects
Trenchless Technology applications deliver high value in urban utility projects by reducing disruption, protecting critical crossings, and improving project outcomes.
Related News
- 00
0000-00
Tunnel Boring Machine Costs: Budgeting for Purchase, Operation, and Project Risk - 00
0000-00
Open-Pit Haulage Cost Analysis: How Mine Managers Can Cut Cost per Tonne - 00
0000-00
Tunnel Construction Innovations That Reduce Risk and Schedule Delays on Urban Projects - 00
0000-00
TBM Disc Cutter Design: Key Geometry and Load Factors for Hard Rock Tunnelling - 00
0000-00
Hydraulic Tipping Stability Risks in Multi-Axle Dump Special Trailers
Weekly Insights
Stay ahead with our curated technology reports delivered every Monday.