
Underground Automation Productivity: Which KPIs Matter Most in Daily Mine Operations?





Underground Automation Productivity: Which KPIs Matter Most in Daily Mine Operations?
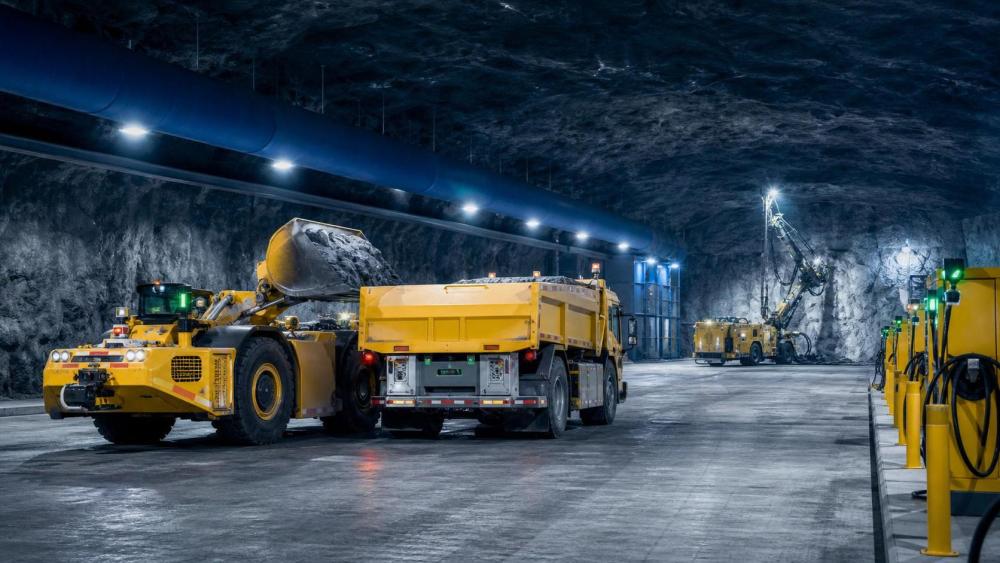
In daily mine operations, underground automation productivity is no longer judged by tons moved alone.
The stronger signal is how well automated assets convert time, power, and data into stable output.
That shift matters because underground systems now combine loaders, haulage, drilling, ventilation, batteries, and remote control into one operating chain.
When one link slows down, overall underground automation productivity drops, even if headline production still looks acceptable.
This is why KPI selection has become a management issue, not just a reporting task.
The right metrics show where automation creates real value and where hidden friction still limits performance.
Why output alone misses the real picture
Many mines still start with tons per shift, meters advanced, or blasted rounds completed.
Those figures matter, but they lag behind the actual causes of daily variation.
An automated LHD may hit target tonnage while wasting queue time at ore passes.
A battery haul truck may complete planned cycles while losing efficiency on gradients and charging windows.
A drilling jumbo may deliver footage but create downstream delays through misaligned face preparation.
So the practical question is simple.
Which KPIs explain whether underground automation productivity is durable, repeatable, and scalable?
The five KPI groups that matter most
In practice, the most useful framework covers five KPI groups.
Together, they give a balanced view of underground automation productivity.
1. Asset utilization KPIs
Automation only pays off when equipment spends more time working and less time waiting.
- Availability: percentage of scheduled time the machine is ready for operation.
- Utilization: percentage of available time spent on productive activity.
- Idle ratio: time lost to queueing, operator absence, traffic conflicts, or dispatch gaps.
- Remote-control engagement rate: share of shift time under autonomous or tele-remote operation.
If availability is high but utilization is low, the issue is usually coordination, not equipment health.
That distinction helps teams protect capital value and improve underground automation productivity faster.
2. Cycle efficiency KPIs
Cycle time is often the clearest day-to-day measure of underground automation productivity.
For LHDs and trucks, track loading time, travel time, dumping time, and return time separately.
For drill-and-blast operations, track setup time, drilling rate, face completion, and re-entry delay.
Look for variance, not only averages.
A stable 14-minute haul cycle is usually more valuable than a volatile 12-minute average.
Predictable cycles improve dispatching, battery planning, maintenance timing, and ventilation control.
3. Safety and intervention KPIs
A mine can raise output briefly while increasing intervention risk.
That is not real underground automation productivity.
- Manual intervention frequency per shift.
- Autonomous stop events per operating hour.
- Near-miss exposure during transitions between manual and automated modes.
- Restricted-zone breach incidents.
When intervention rates rise, the root cause may be poor mapping, inconsistent ground conditions, or sensor contamination.
These events directly reduce confidence in automated systems and weaken shift-level planning.
4. Energy and emissions KPIs
Energy performance is now central to underground automation productivity, especially in battery-electric fleets.
- kWh per ton hauled or per meter advanced.
- Charging or battery swap time per cycle.
- Regenerative braking recovery rate on decline routes.
- Ventilation demand reduction linked to zero-emission equipment use.
This matters because electrification changes both operating cost and infrastructure load.
A machine that looks productive in isolation may still stress charging schedules or airflow capacity.
5. Downtime and reliability KPIs
The final group shows whether performance can hold under real underground pressure.
- Mean time between failure.
- Mean time to repair.
- Downtime by cause: mechanical, electrical, software, network, ground condition, or waiting on services.
- Repeat fault rate within seven days.
This breakdown prevents a common mistake.
Teams often blame the machine when the real issue is network coverage, charging congestion, or water ingress.
How to connect KPIs to daily decisions
Good KPI design supports action during the shift, not just reporting after the fact.
That means each metric should answer a clear operational question.
This approach keeps underground automation productivity tied to operational control.
Common KPI mistakes in automated mines
Several mistakes show up again and again in automated underground projects.
- Using too many KPIs and losing focus during shift reviews.
- Measuring fleet averages while hiding poor performance at a specific heading or route.
- Treating software alarms and mechanical faults as one downtime category.
- Ignoring transition losses between drilling, mucking, charging, and ventilation clearance.
- Reviewing data weekly when conditions change every shift.
These gaps make underground automation productivity appear stronger than it really is.
More importantly, they delay corrective action until losses become structural.
A practical KPI stack for daily mine operations
For most sites, a compact KPI stack works better than a long dashboard.
A strong daily set could include the following eight metrics.
- Equipment availability by asset type.
- Productive utilization by shift.
- Cycle time median and variance.
- Manual interventions per operating hour.
- Autonomous stop causes by category.
- kWh per ton or per meter.
- Downtime minutes by root cause.
- Recovery time after unplanned stoppage.
This stack gives enough detail to manage underground automation productivity without overwhelming decision makers.
It also supports clearer conversations between operations, maintenance, automation, and energy teams.
What better KPI discipline changes over time
From a longer-term view, KPI discipline does more than improve reports.
It improves equipment selection, charging design, route planning, and maintenance strategy.
It also strengthens investment cases for tele-remote drilling, battery swapping, fleet electrification, and underground network upgrades.
That is where underground automation productivity becomes a strategic lever rather than a daily scorecard.
The most effective sites keep the KPI set small, causal, and operationally useful.
Start with utilization, cycle efficiency, intervention, energy, and downtime.
Then refine thresholds by asset type, route, and shift condition.
That is usually the fastest route to stronger underground automation productivity in real mine operations.
Related News
How to Evaluate Articulated Dump Trucks Payload for Haul Road Conditions and Cycle Efficiency
Articulated Dump Trucks payload evaluation starts with real haul road conditions, not brochure numbers. Learn how to balance payload, traction, grades, and cycle efficiency for safer, higher output.
How Pipe Fittings Material and Pressure Class Affect Water Line Selection
Pipe fittings selection starts with material and pressure class. Learn how these factors affect water line reliability, corrosion resistance, installation, and long-term cost.
What Drives TBM Excavation Cost in Urban Tunneling Projects?
tbm excavation cost in urban tunneling depends on geology, shafts, segment lining, logistics, and risk. Discover the key cost drivers and compare bids with greater confidence.
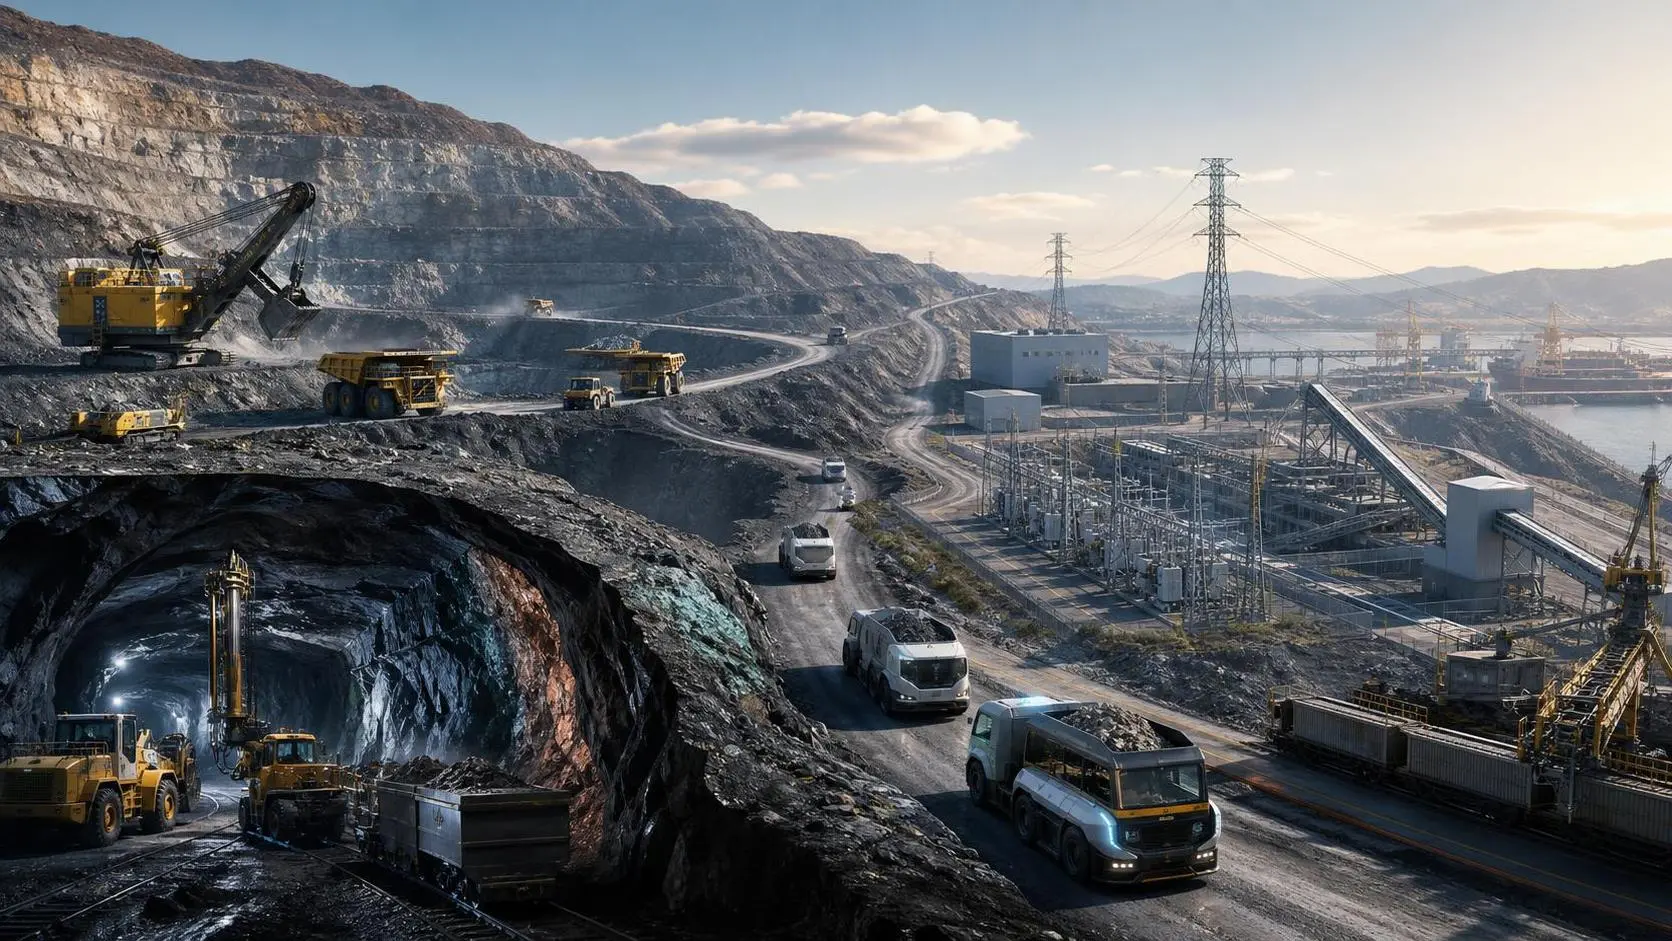
What Does Energy Metals Mining in Australia Mean for Supply, Cost, and Project Risk?
Energy metals mining Australia is reshaping supply, cost, and project risk. Discover what it means for buyers, investors, and operators.
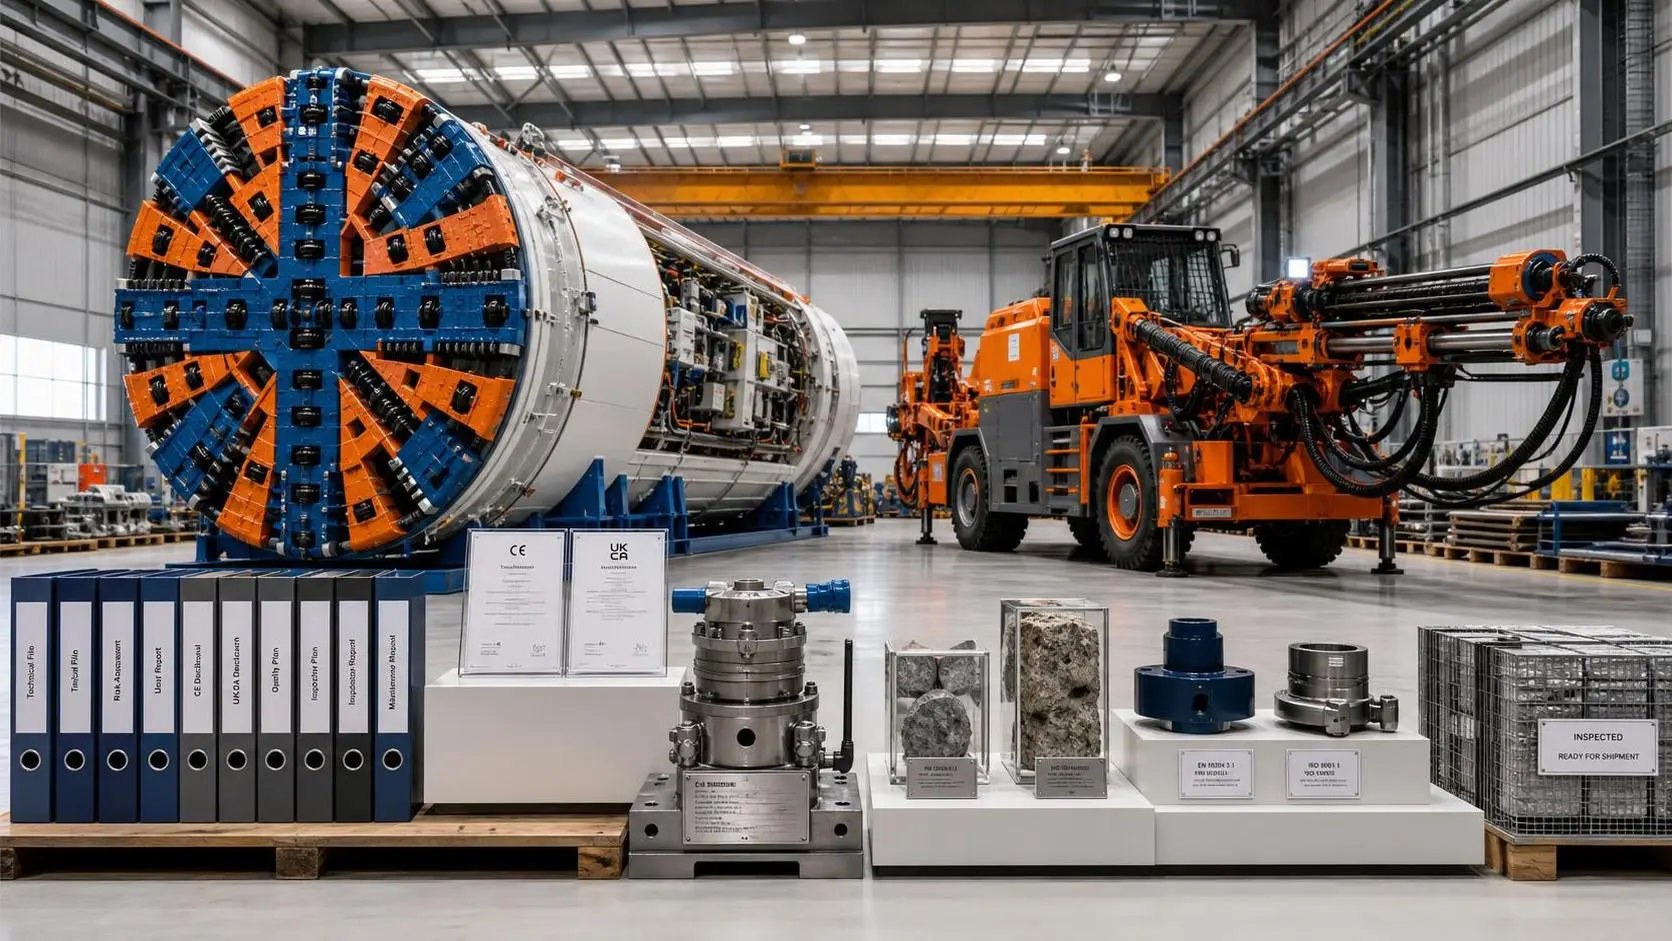
EU Eases Dual CE and UKCA Path for Chinese Tunnel Boring Equipment
EU eases CE and UKCA certification for Chinese tunnel boring equipment, cutting compliance time and helping importers move faster.
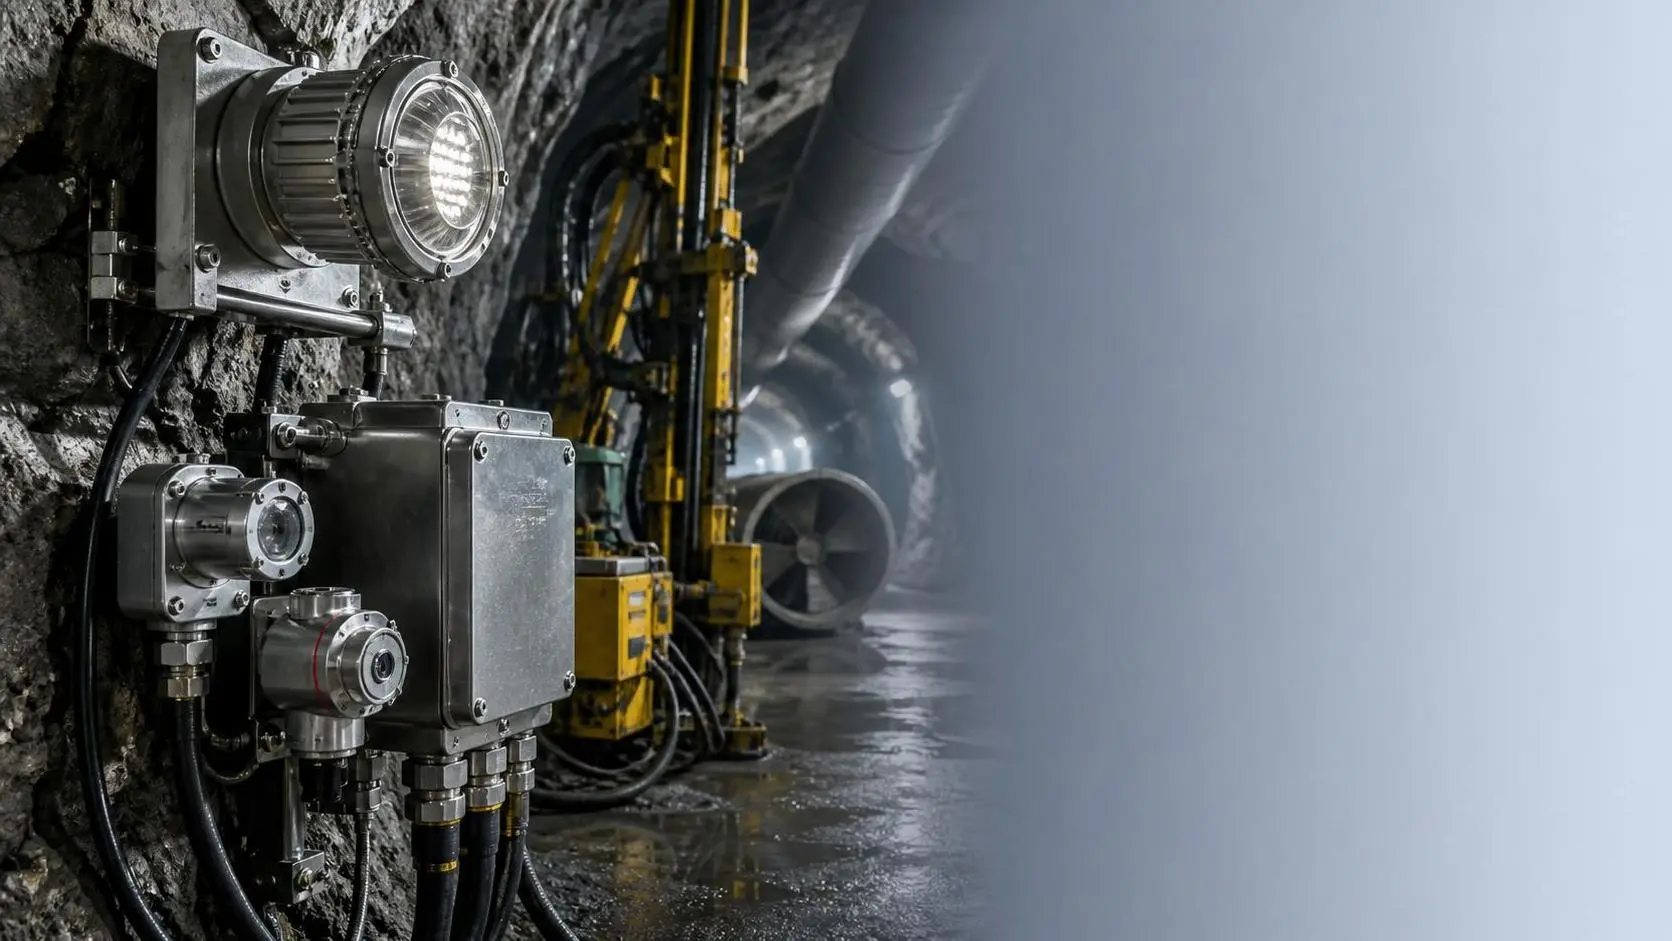
Flameproof Underground Safety Equipment: What Mine Teams Should Check Before Buying
Underground Safety Equipment flameproof buying guide: learn how mine teams should verify certification, durability, serviceability, and supplier support before purchase.
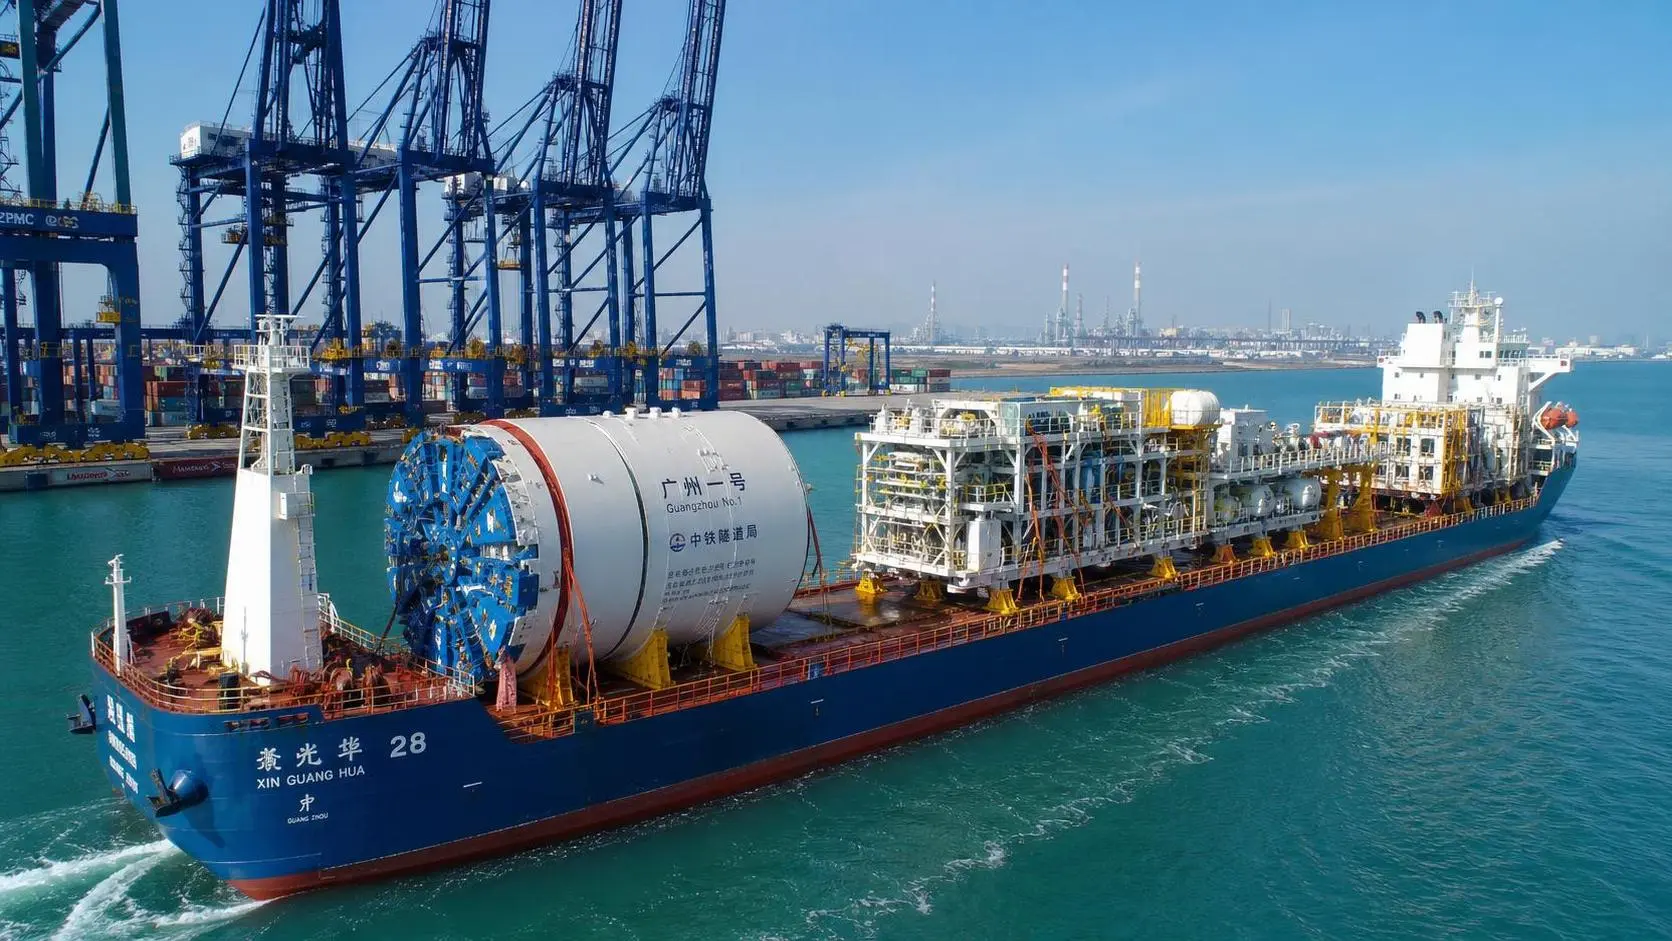
China-UAE Direct Sea Route Cuts TBM and Large Tunneling Equipment Lead Times
China-UAE direct sea route shortens TBM and large tunneling equipment lead times by 12–15 days, improving delivery predictability for major infrastructure projects. Read the full impact.
What Is a TBM Guidance System Gyroscope, and Why Does It Matter Underground?
TBM Guidance Systems gyroscope improves underground accuracy, reduces drift, and helps tunnel boring machines stay on line in harsh conditions.
China to Roll Out Nationwide Local and Foreign Currency Cash Pools for Multinationals on Sept. 14
China will roll out nationwide local and foreign currency cash pools for multinationals on Sept. 14, streamlining cross-border treasury management and boosting liquidity efficiency.
Related News
- 00
0000-00
How to Evaluate Articulated Dump Trucks Payload for Haul Road Conditions and Cycle Efficiency - 00
0000-00
How Pipe Fittings Material and Pressure Class Affect Water Line Selection - 00
0000-00
What Drives TBM Excavation Cost in Urban Tunneling Projects? - 00
0000-00
What Does Energy Metals Mining in Australia Mean for Supply, Cost, and Project Risk? - 00
0000-00
EU Eases Dual CE and UKCA Path for Chinese Tunnel Boring Equipment
Weekly Insights
Stay ahead with our curated technology reports delivered every Monday.